 |  |
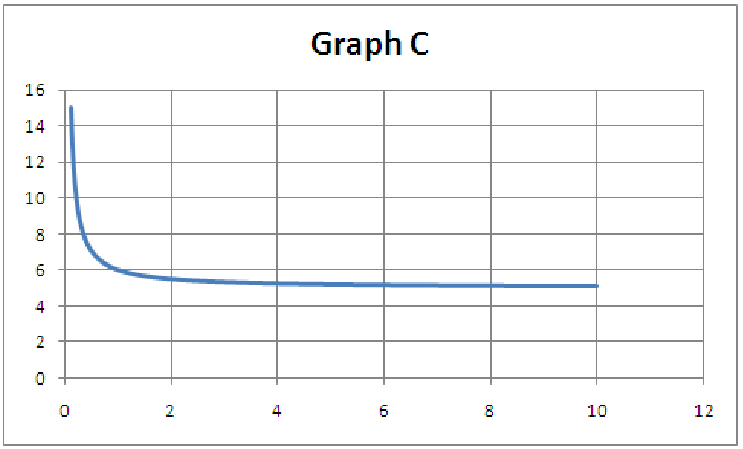 | 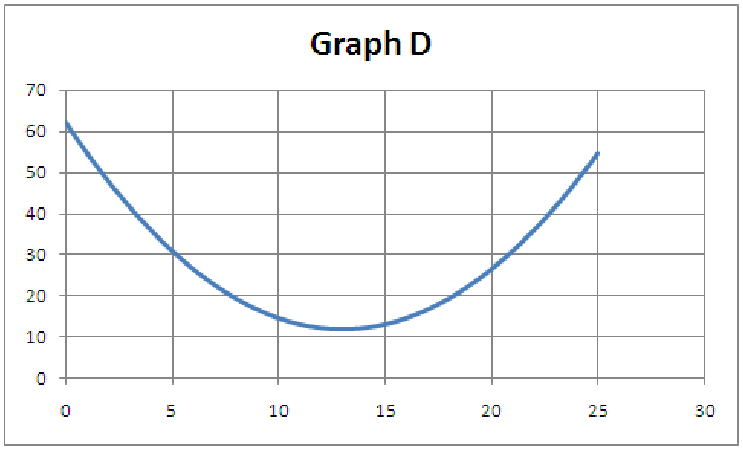 |
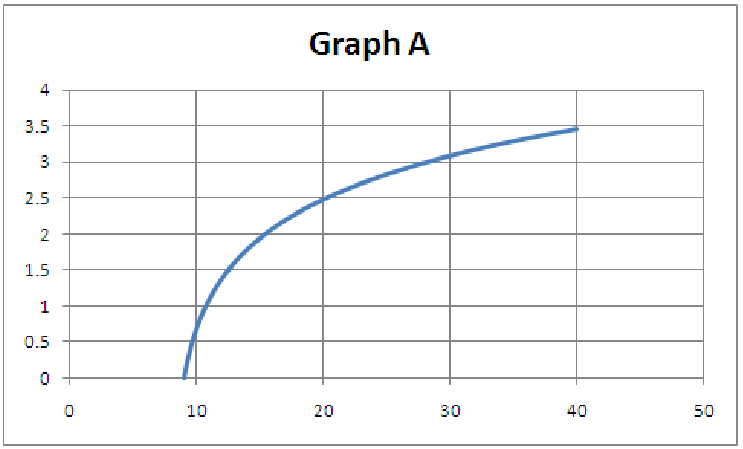
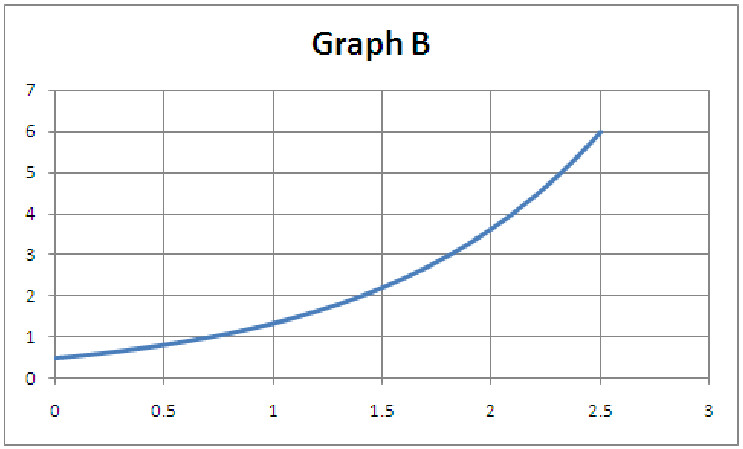
Figure 11.18: Graphs for problem 5.
11.1. This problem deals with what happens to equations of functions and graphs of functions if you apply several different transformations, one after the other. Take y = f(x) = x2 and write out each of the following functions. For each step, explain what happens to the graph in terms of how the particular change affects the appearance of the previous graph in the sequence.
| Function | Written out | What happens to graph |
| y = f(x) = x2 |
|
|
|
|
|
|
| y = f(x - h) |
|
|
|
|
|
|
| y = af(x - h) |
|
|
|
|
|
|
| y = af(x - h) + k |
|
|
|
|
|
|
11.2. How would the results in problem 1 be different if we changed the order to y = a[f(x - h) + k]?
| Function | Written out | What happens to graph |
| y = f(x) = x2 |
|
|
|
|
|
|
| y = f(x - h) |
|
|
|
|
|
|
| y = f(x - h) + k |
|
|
|
|
|
|
| y = a[f(x - h) + k] |
|
|
|
|
|
|
11.3. Now repeat 1 with a basic exponential function.
| Function | Written out | What happens to graph |
| y = f(x) = exp(x) |
|
|
|
|
|
|
| y = f(x - h) |
|
|
|
|
|
|
| y = af(x - h) |
|
|
|
|
|
|
| y = af(x - h) + k |
|
|
|
|
|
|
11.4. Now repeat 1 with a basic logarithmic function.
| Function | Written out | What happens to graph |
| y = f(x) = ln(x) |
|
|
|
|
|
|
| y = f(x - h) |
|
|
|
|
|
|
| y = af(x - h) |
|
|
|
|
|
|
| y = af(x - h) + k |
|
|
|
|
|
|
11.5. For each of the five graphs below
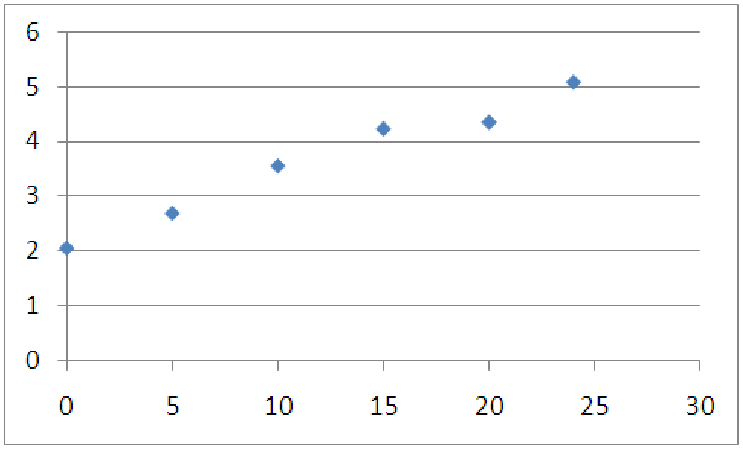
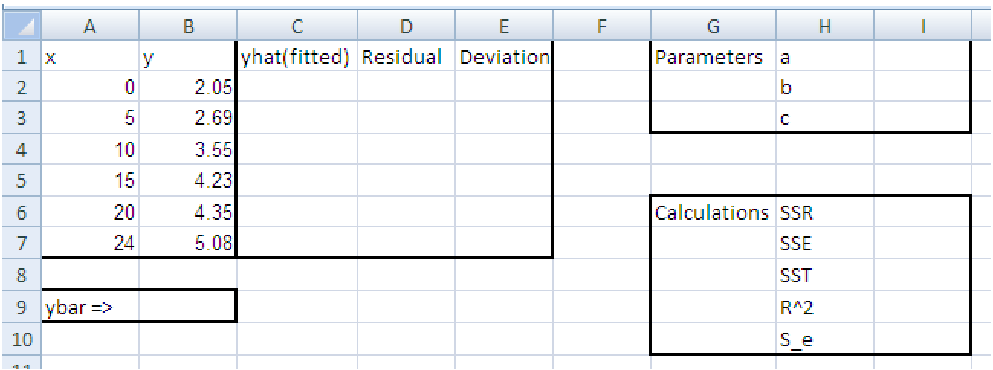
11.6. Consider the data shown below in both table and graphical format.
| x | y |
| 0 | 2.05 |
| 5 | 2.69 |
| 10 | 3.55 |
| 15 | 4.23 |
| 20 | 4.35 |
| 24 | 5.08 |
| Order | Equation | R2 |
| 2 |
|
|
|
| ||
| 3 |
|
|
|
| ||
| 4 |
|
|
|
|
|
|
| 5 |
|
|
|
|
|
|
| 6 |
|
|
|
|
|
|