14.4. We are given the following information regarding a product:
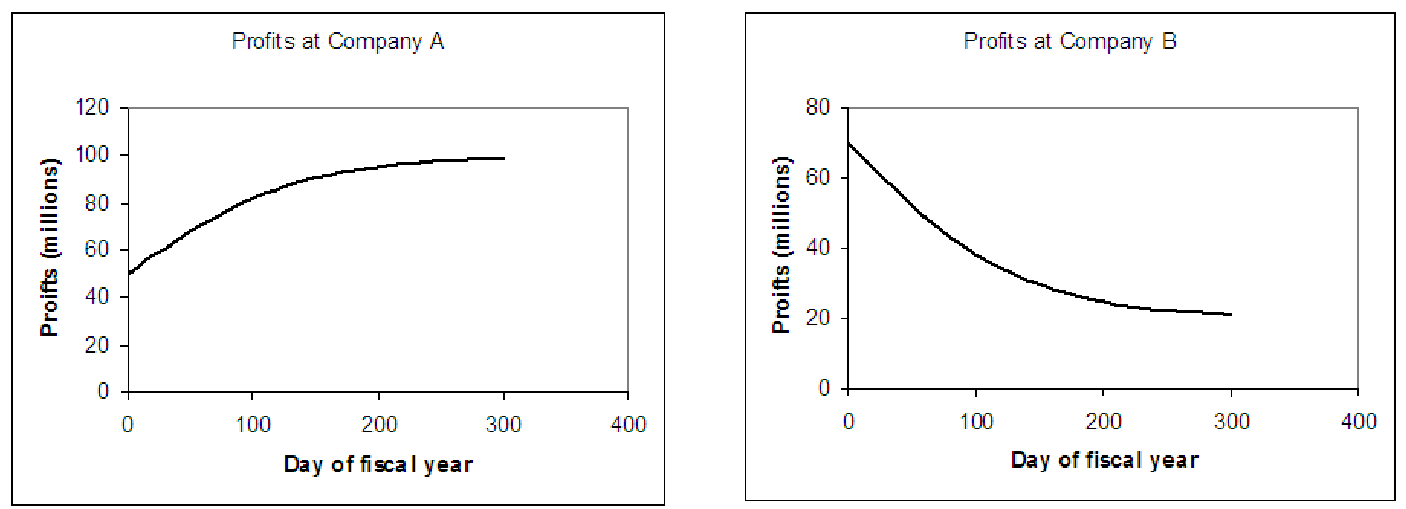
14.5. Consider the profit graphs of each of the two companies shown in figure 14.9 from two different perspectives: the managers of the company (who want to keep their jobs) and the shareholders in the company (who want to make more money). For each graph, consider everything: the value of the function plotted on the graph, the rate of change of that function and the concavity (rate of change of the rate of change). Answer the following questions:
14.6. Re-examine the situation in problem 5, only this time, imagine that the graphs given show the rate of change in the profits (millions of dollars per day) rather than the profits themselves.
14.7. Data file C14 MacroSoft Profits.xls [.rda] contains data on weekly profits over each of the past 52 weeks. The profits are in thousands of dollars. Also shown are the corresponding number of units of software sold each week. At yesterday’s board meeting, the operations manager claimed that the data shows profits are increasing as we produce more units of software. This means that the company can produce as much software as they want and continue to make profits. The CEO never believes news this good. Analyze the data, build some models for the profits, and analyze this claim.