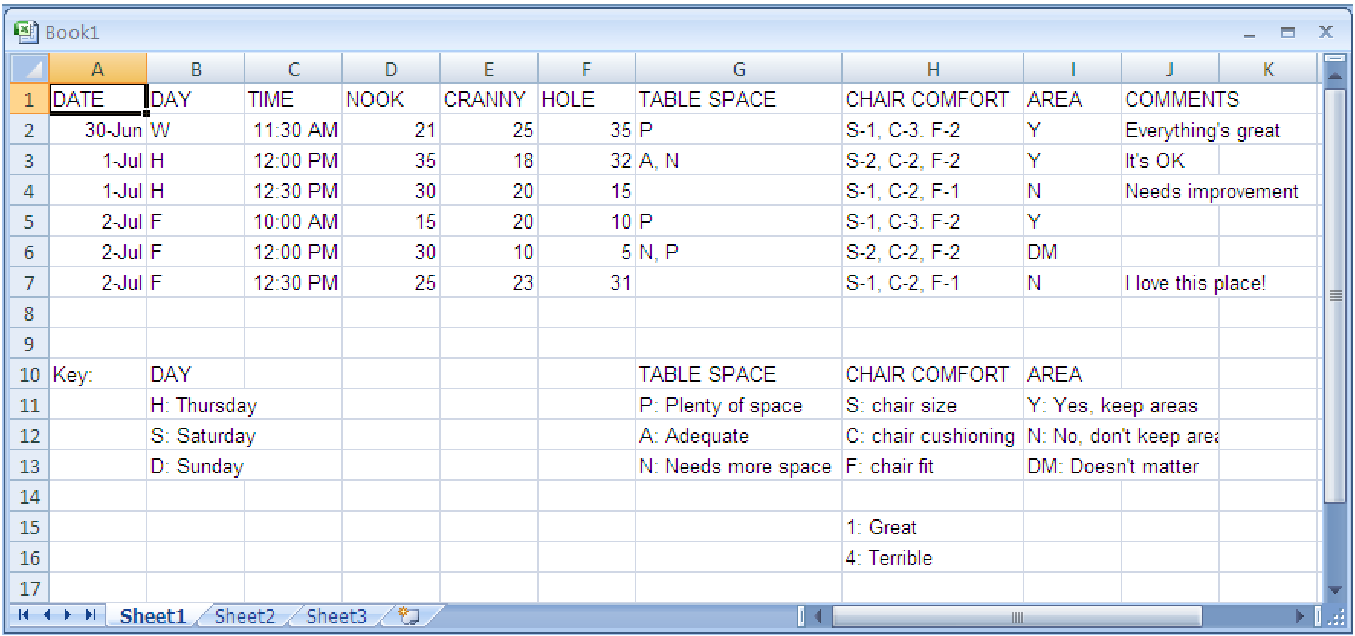
Figure 2.1: Example of poor data organization.
Example 2.4. An example of poor data entry
The following spreadsheet shows an incorrect attempt to enter the data from the Data
Collection Form for Seating Patterns and the Remodeling Questionnaire form that were
developed previously (example 2). In order to save space, only a few observations are
shown (A2-J4). The description of the categories for each of the variables is found in
cells C7-I10; normally these would appear as comments in spreadsheet in the column
headings.
There are several major errors in the way the data has been entered into the spreadsheet in figure 2.1.
NOTE: The next two examples and spreadsheets show a better way of entering the data from the above data collection forms. (All of these are in data file C02 Over Easy.xls [.rda].) Two spreadsheets (or at lesat two workbooks in a single spreadsheet) are necessary because the observations cannot be combined into one spreadsheet, as we saw in example 4. Explanations for the coding of the data from each form are provided (these are not the only ”correct” answers; there are different options for each). Four sample observations are shown in each spreadsheet.
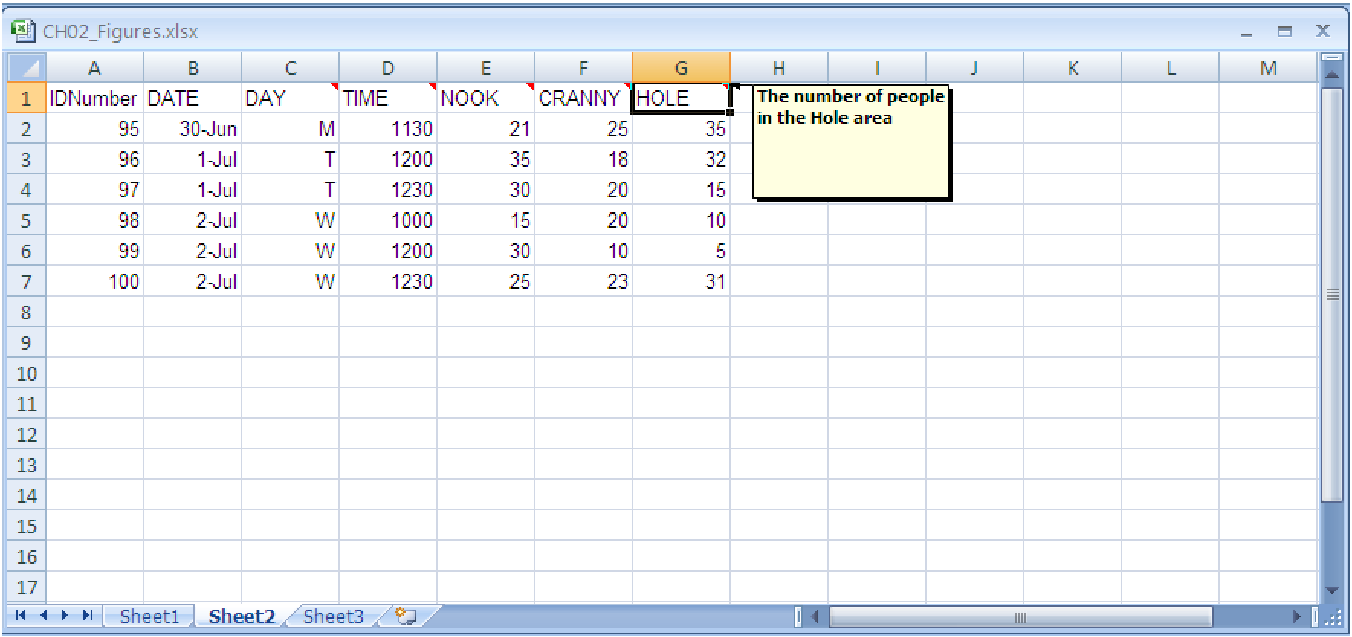
Example 2.5. Coding the Data from the Collection Form for Seating Patterns
Our data collection form contains the following variables. Each variable is described, along with its unit and categories. The data type for each variable is described in parentheses after the description.
| Variable Name | Type | Units/Categories/Notes |
| IDNumber | Identifier - Numeric | A one- to three-digit number identifying consecutive observations starting with 1, the first observation taken on June 30 at 11:30 A.M. |
| Date | Numeric - discrete |
|
| Day | Categorical - ordinal | M: Monday, T: Tuesday, W: Wednesday, H: Thursday, F: Friday, S: Saturday, D: Sunday |
| Time | Numeric - discrete | The time of day will be converted to military time, where: 5:00 A.M. is 500, 5:30 A.M. is 530, 12:00 P.M. is 1200, 1:00 P.M. is 1300, 1:30 P.M. is 1330. Military time eliminates the necessity of using the A.M./P.M. designators. Although the conventional A.M./P.M. way of recording time is probably more user friendly for the people who had to collect the data, they disrupt the natural order of time necessary for analysis. |
| Nook | Numeric-discrete | The number of people in the Nook area |
| Cranny | Numeric-discrete | The number of people in the Cranny area |
| Hole | Numeric-discrete | The number of people in the Hole area |
Notice that the name variable ”HOLE” has been selected in the spreadsheet (figure 2.2) and a pop-up comment has been displayed describing how this variable has been coded. You can also see the other comment triangles in the upper right part of the other cells in the row. These contain the descriptions of how each variable has been coded.
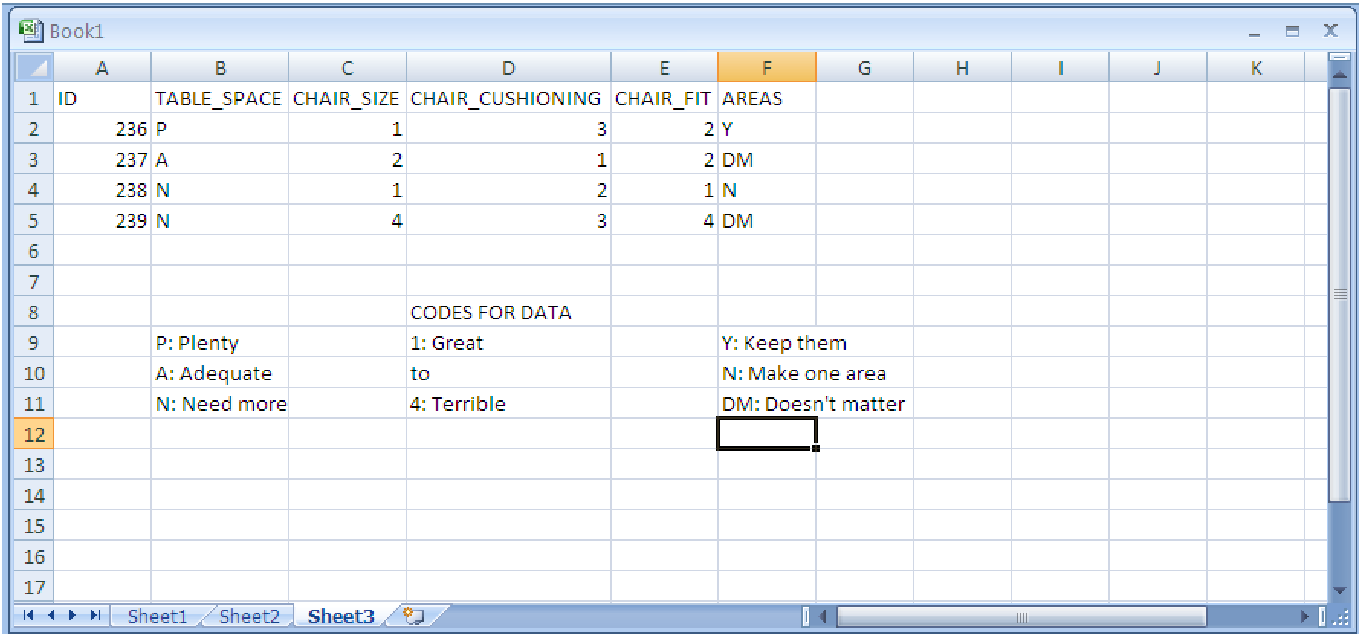
Example 2.6. Coding the Data from the Remodeling Questionnaire
In the spreadsheet in figure 2.3, the codes for the data are written at the bottom of the data on the
spreadsheet itself for convenience. Most often, descriptions of codes are either inserted as
comments in the variable name cells (as we saw above) or written separately from the spreadsheet
in the report of the analysis.