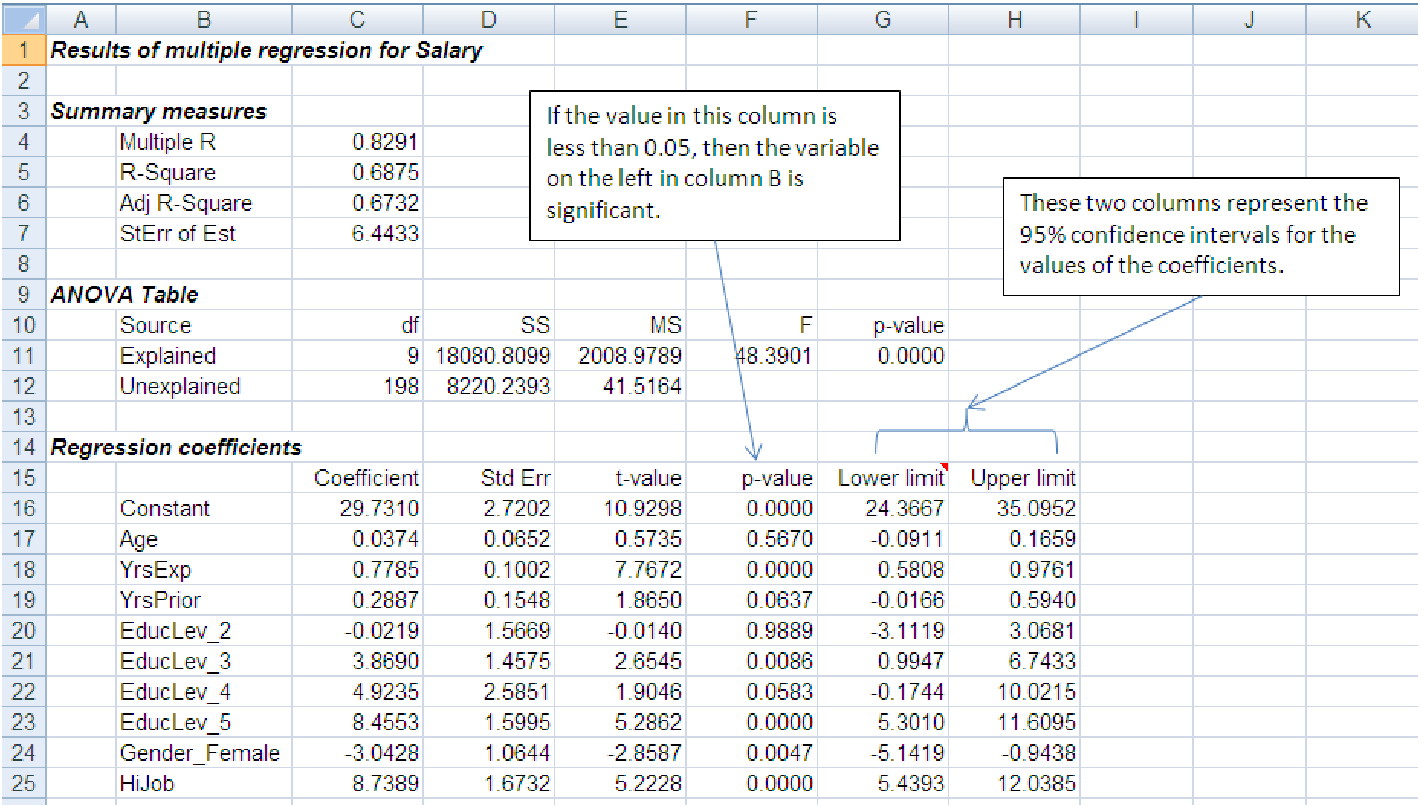
Figure 10.1: Multiple regression results with p-values and confidence intervals highlighted.
Example 10.1. Determining significance of a variable from a confidence interval
We look to the last three columns of the ”Regression coefficients” block in the spreadsheet below
to determine if a variable is significant. This data is shown in file C10 Enpact Data.xls [.rda].
The variable HiJob is a dummy variable that is 1 if the employee’s job grade is 5 or
6.
We can be 95% confident that the coefficient of a variable, say Age, lies somewhere between the lower-limit number, -.0911, and the upper-limit number, .1659. Since the lower limit is negative and the upper limit is positive, the coefficient, given as .0374, could very well be 0. This means that the variable is insignificant. On the other hand, if the signs of the lower and upper limits are the same, then we can be 95% confident that the associated variable (or the constant in the case of the first row) is not zero and is therefore significant at a 95% level of confidence. For example, we can be 95% confident that the variable YrsExp is significant and that its coefficient lies somewhere between .5808 and .9761.
Example 10.2. Determining the significance of a variable from a p-value
We can determine if a variable, say HiJob, is significant by examining the p-value of its coefficient
(third column from the right in the regression output.) Since its p-value, .0000, is less than .05, we
can expect that its coefficient, 8.7389, will be zero less than 5% of the time. This means that we
can expect the coefficient will not be zero 95% of the time and therefore the variable is significant
at a 95% level of confidence. On the other hand, the p-value of the coefficient of the Age variable is
.5670, which is greater than .05. This says that the Age variable is insignificant because we
cannot be confident that its coefficient, 0.0374, is nonzero less than 5% of the time.
Example 10.3. The relative advantages of using confidence intervals vs p-values
A confidence interval not only tells us whether a variable is significant or not, it also
gives us a range of values within which we can be 95% confident that the coefficient
will lie. A p-value only tells us whether a variable is significant or not. On the other
hand, the eye can scan a single column of p-values for significance much quicker and
readily than it can scan two columns of numbers looking for a sign change across them.
Example 10.4. Refining your model
The presence of insignificant variables in a model is usually a cause for concern. The reason is this:
the presence of insignificant variables raises the model’s R2 by introducing information in which we
should not have confidence. In other words, insignificant variables inflate the model’s R2 so that it
is not a reliable indicator of how well the model fits the data. This means that we could be basing
our inferences and decisions on a faulty model, which, in turn, could lead to disastrous
consequences.
To avoid the problem of producing an untrustworthy model, we rerun the regression routine after leaving out all the insignificant variables. Our new reduced model will now be built with significant explanatory variables, each of which has passed the 95% confidence test.
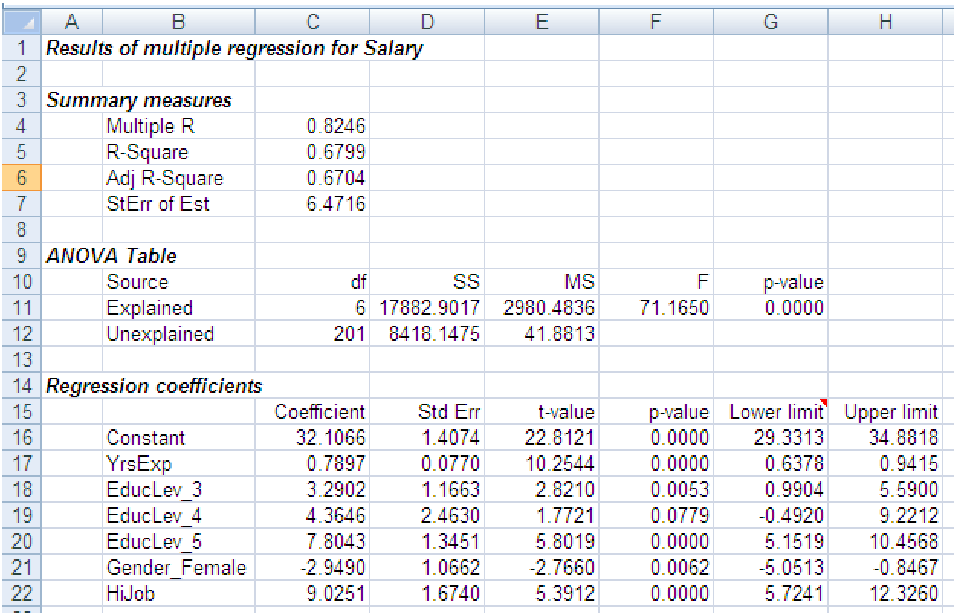
After dropping the insignificant variables from the model displayed in example 1, our reduced model will now be based on the following significant variables: YrsExp, HiJob, GenderFemale, EducLevel3, EducLevel4, and EducLevel5. The resulting reduced model is shown below:
Notice that the R2 of our reduced model, 0.8246, is smaller than the R2 of the original full model, but only by .0045. For all practical purposes, the R2 of the original model and the reduced model are the nearly identical. Similarly, the Se of the reduced model, 6.4716, is larger than the Se of the full model, but only by .0283, which again, for all practical purposes, is nearly identical. Other models, however, may show much larger differences between the R2 and S e of the full model and a reduced one.
This example illustrates another principle of good modeling practice: the principle of parsimony. The principle of parsimony can be thought of as a principle of simplicity. If a smaller set of explanatory variables produces a model that fits the data almost as well as a model with a larger set of explanatory variables - and with almost the same standard error - it is usually preferable to use the model with the smaller number of explanatory variables. As we shall see, each explanatory variable in a model comes with a price, not only in terms of increasing the unwieldiness of the model, but more importantly in terms of understanding or explaining how the particular variable affects the dependent variable.
Also notice that one of the variables in the original example 1, the variable EducLevel4, was on the border between being significant and not. Its value of 0.0583 is right about equal to the cutoff of 0.05. Because the p-values change dramatically as variables are eliminated from the model, it is important to leave such borderline variables in the model at first and see if they become more significant. In this case, the p-value got larger when we eliminated some of the variables; in the reduced model, it is definitely not significant at a p-value of 0.0779. In fact, because of the way p-values change as the variables are eliminated, it is always best to eliminate one variable at a time, making a new model as each of the variables is dropped and re-assessing which variables are significant. Often, a variable that began an insignificant can become significant.
Summary: Refining a model is both an art and a science. The general procedure is: