- Whether the relationship between two variables is direct, indirect or neither.
- The strength of the linlear relationship between two variables.
Correlation is a number between -1 and +1 and is determined by the formula below, based on the z-scores of the two variables (the variables are called x and y in the formula).
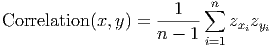
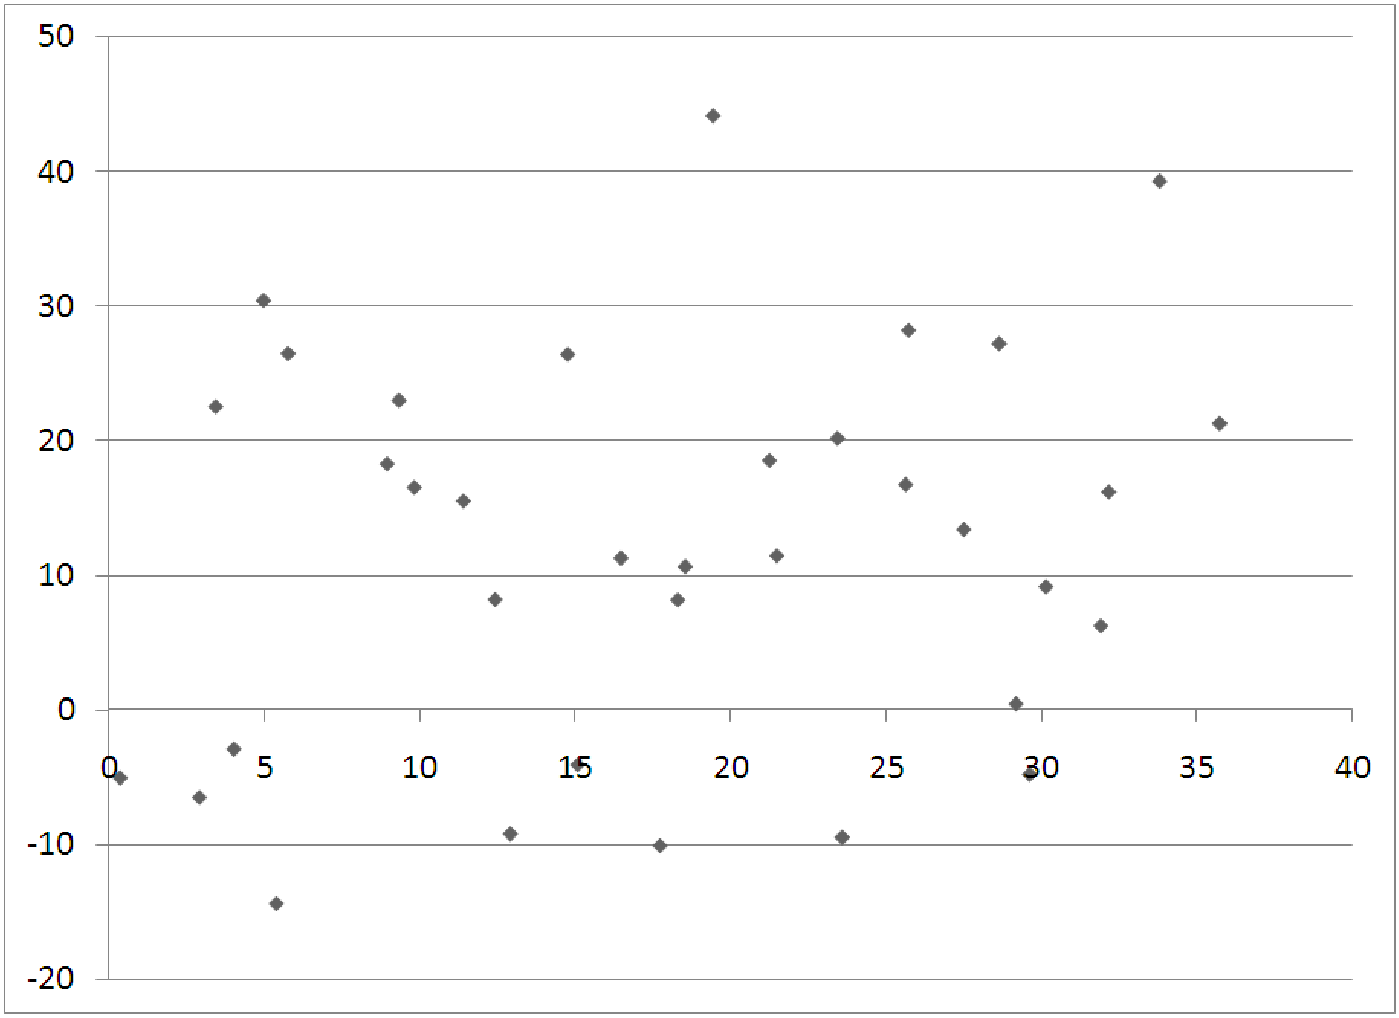
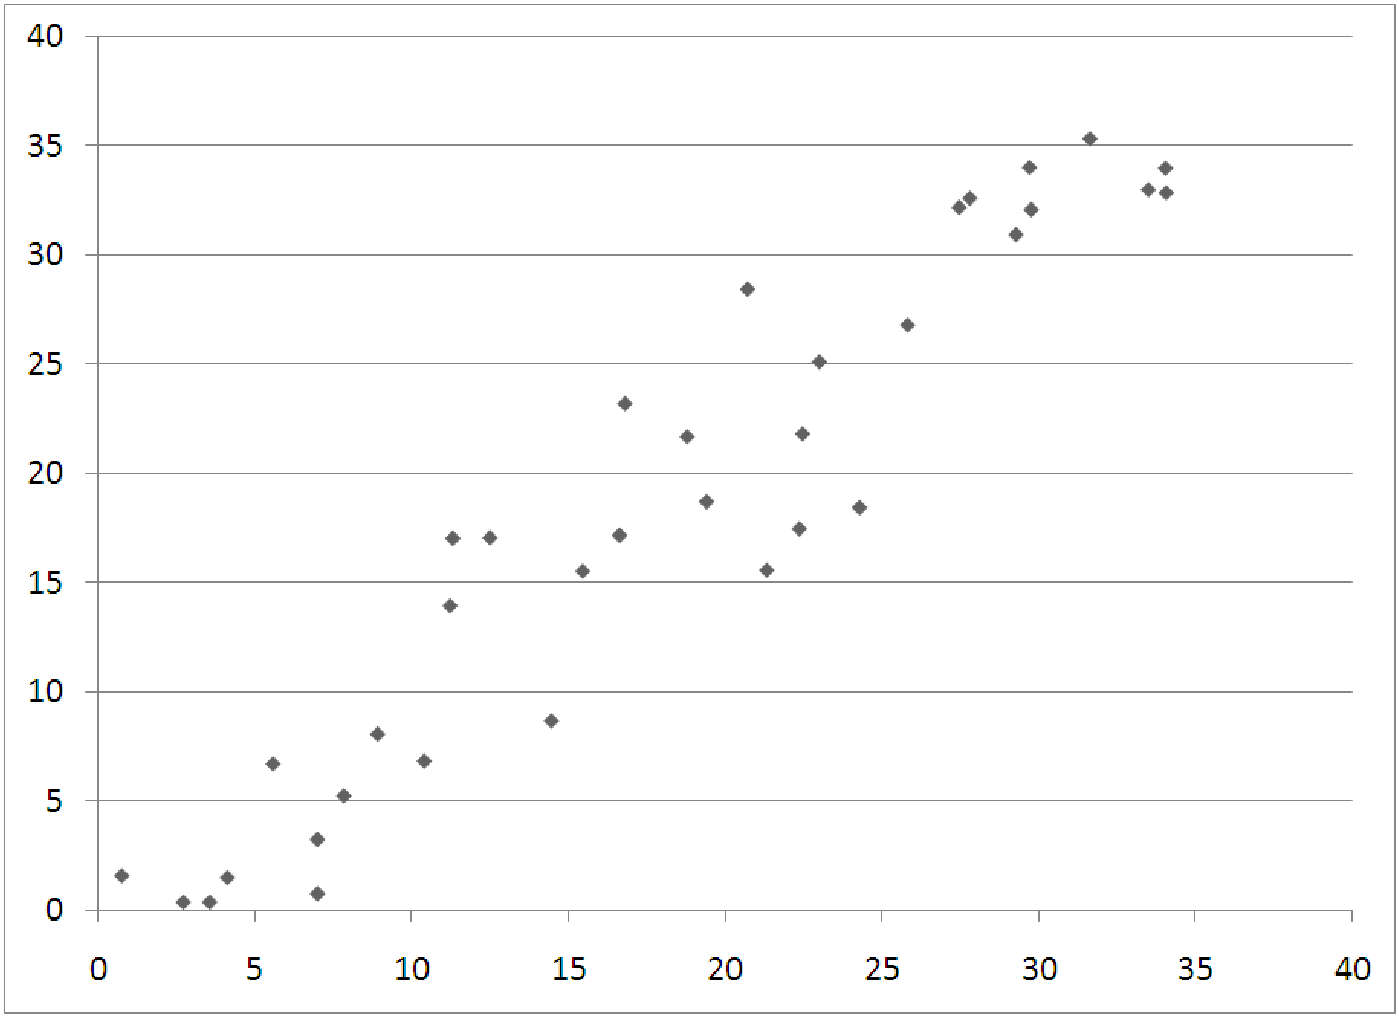
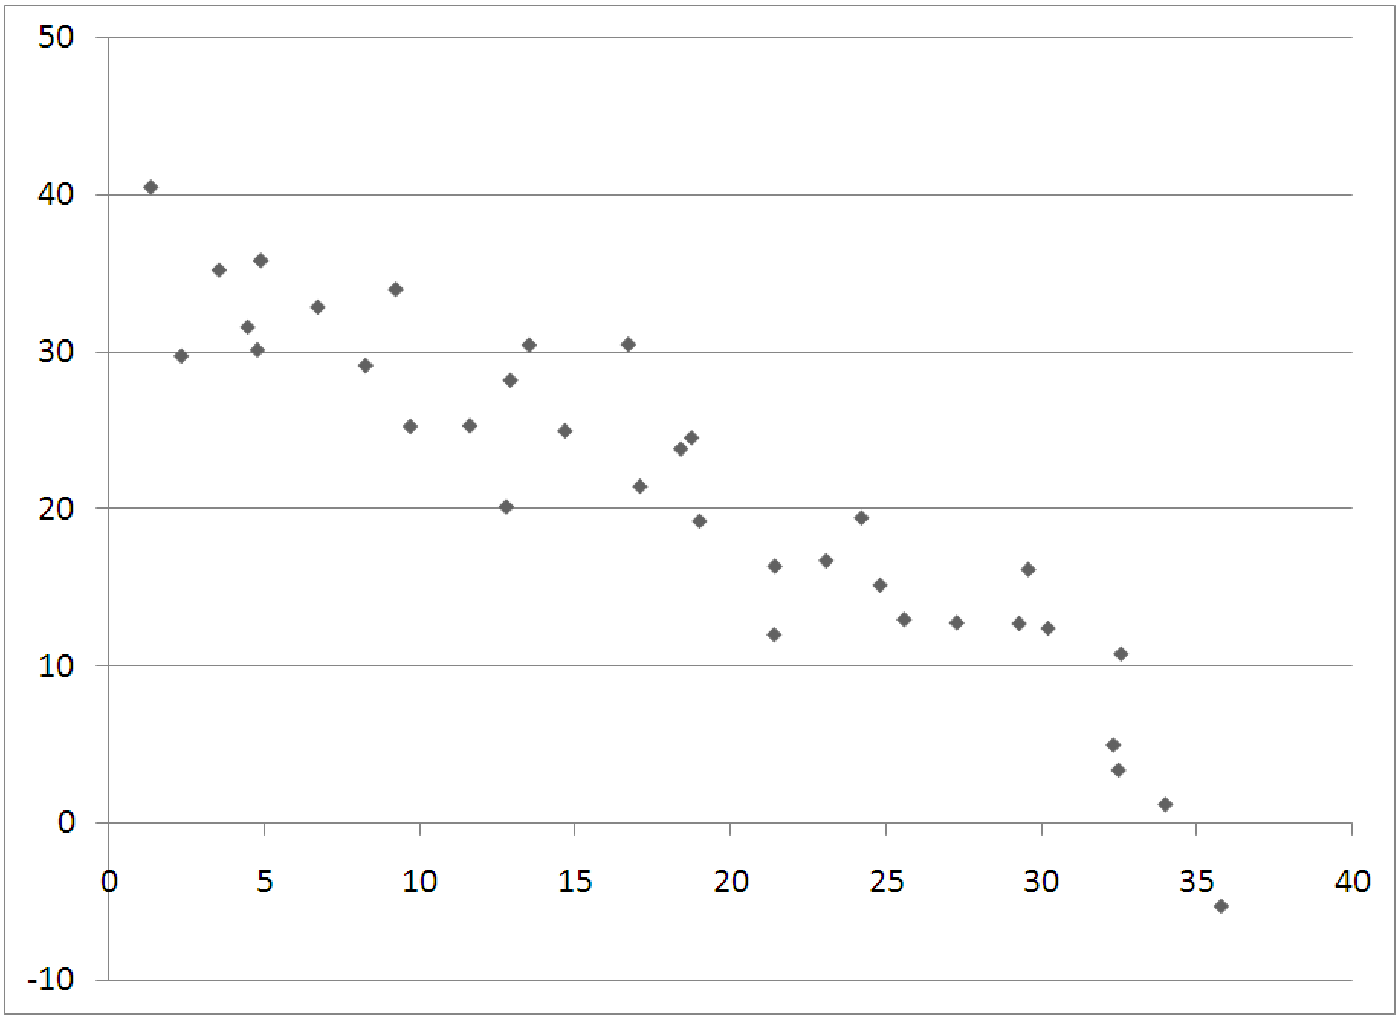
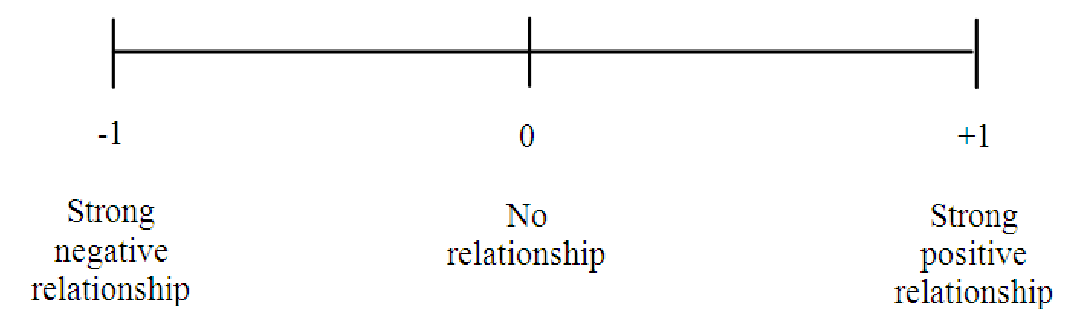
Notice that since this formula is based on the z-scores of the data, the overall correlation coefficient has no units. This makes it easier to interpret. Positive correlation means positive relationship, negative correlation means a negative relationship. Correlations close to +1 or -1 indicate strong relationships, while correlations close to zero indicate weak relationships, as shown in figure 7.4.
| Table of correlations | Age | Credits | WorkHours | SleepHours | GPA |
| Age | 1.000 | ||||
| Credits | 0.221 | 1.000 | |||
| WorkHours | 0.658 | -0.439 | 1.000 | ||
| SleepHours | 0.775 | -0.886 | -0.228 | 1.000 | |
| GPA | 0.342 | 0.669 | -0.824 | 0.713 | 1.000 |