7.1.3 Exploration 7A: Predicting the Price of a Home
Instructions: Using data file C02 Homes.xls [.rda], answer each question below.
- Compute the mean and standard deviation for each of the following numerical variables:
|
|
|
|
|
|
|
| | Taxes | Year | Acres | Size | Value | Price |
| | | | | | | |
|
|
|
|
|
|
|
| Mean | | | | | | |
| | | | | | | |
| | | | | | | |
|
|
|
|
|
|
|
| Standard | | | | | | |
| deviation | | | | | | |
| | | | | | | |
|
|
|
|
|
|
|
| |
- Using the mean as a model, how much would you say the typical single-family home costs in
this market?
- How reliable is your estimate?
- Using a table of correlations, calculate the correlation coefficient (r) for the following pairs of
variables:
|
|
|
|
|
|
|
|
|
|
| | Taxes | Style | Bath | Bed | Rooms | Year | Acres | Size | Value |
|
|
|
|
|
|
|
|
|
|
| Price | | | | | | | | | |
| | | | | | | | | | |
| | | | | | | | | | |
|
|
|
|
|
|
|
|
|
|
| |
- Based on the correlation coefficients, which of the above variables seems to have the MOST
effect on the PRICE of a house? Which as the LEAST effect?
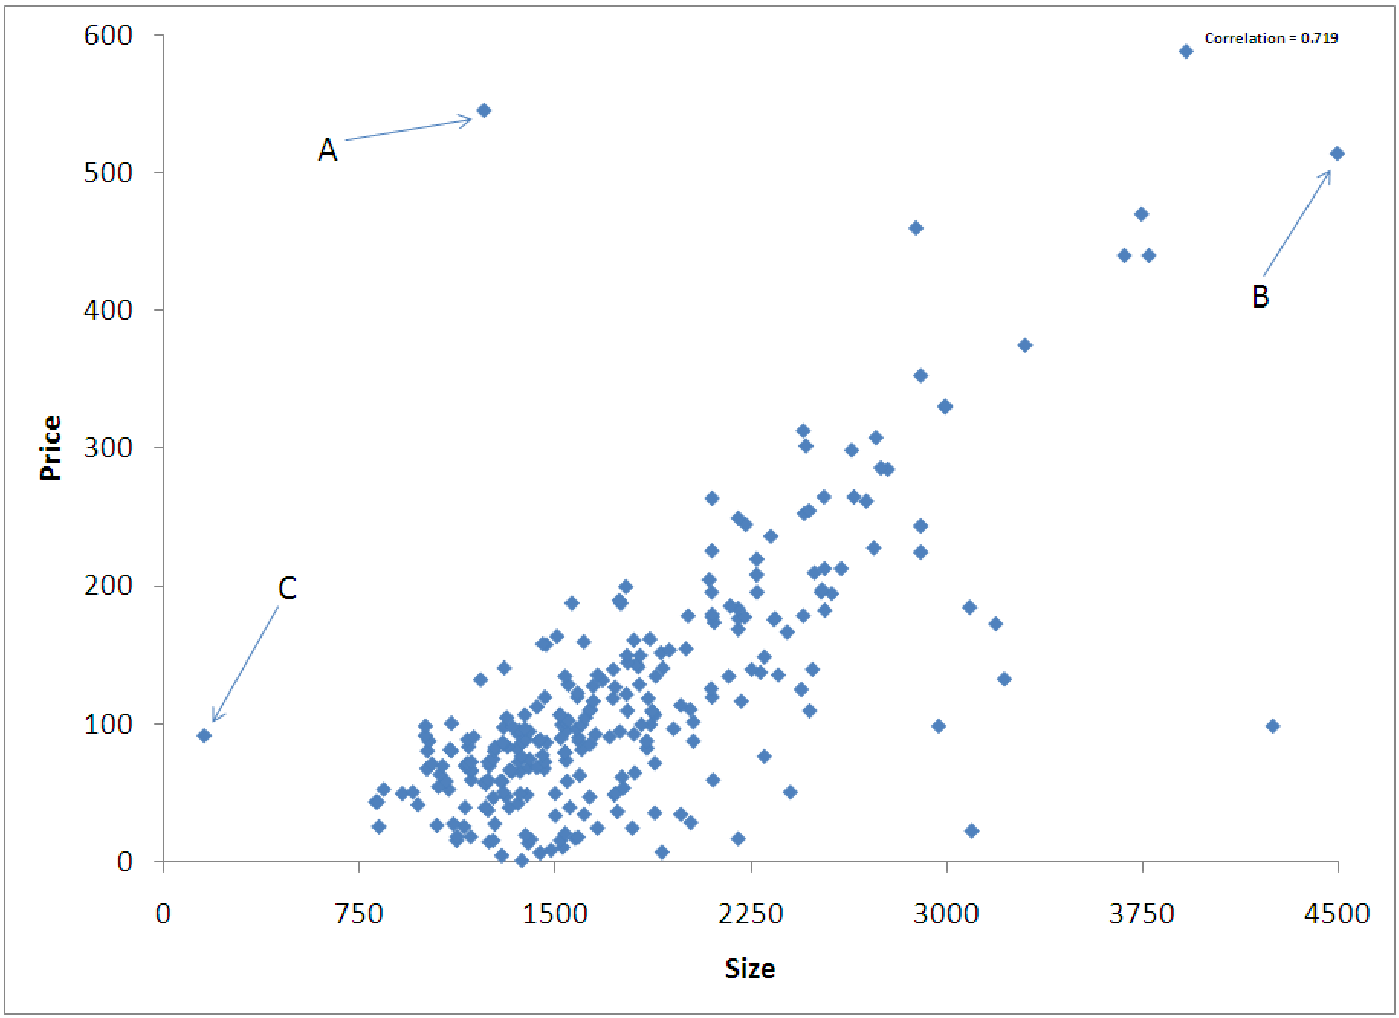
- Generate a scatterplot that describes the relationship between PRICE and SIZE. Which
variable is the independent variable (should be on the x-axis)? Which variable is the
dependent variable (on the y-axis)? What is the Correlation for this relationship? Your
scatterplot should look something like figure 7.11.
- Draw a vertical line on the above chart to represent the MEAN for SIZE
- Draw a horizontal line on the above chart to represent the MEAN for PRICE.
- Hover your mouse over the points marked A, B and C on the chart to determine the values
for PRICE and SIZE at each point. Then fill in the table below to estimate the
correlation.