 ), the reciprocal function (b = -1), and the
basic linear function (b = 1). This family is called the family of power functions because
the independent variable, x, is always raised to a power. The shape of a power function
depends on whether the power, b, is even or odd. Even power functions look something
like a ”U” when graphed. Odd power functions (with b > 1) look more like chairs: on
the left they drop off; on the right they rise up high; in the middle they are relatively
flat. All basic power functions pass through the origin (0, 0) and the point (1, 1). This
is because zero raised to any power is zero and 1 raised to a power is always 1.
), the reciprocal function (b = -1), and the
basic linear function (b = 1). This family is called the family of power functions because
the independent variable, x, is always raised to a power. The shape of a power function
depends on whether the power, b, is even or odd. Even power functions look something
like a ”U” when graphed. Odd power functions (with b > 1) look more like chairs: on
the left they drop off; on the right they rise up high; in the middle they are relatively
flat. All basic power functions pass through the origin (0, 0) and the point (1, 1). This
is because zero raised to any power is zero and 1 raised to a power is always 1.

Notice that since anything raised to the zero power is 1, there is no need to write x0 in the last term. Each of the individual combinations of a coefficient and a power function in a polynomial is called a term. Polynomials include several well-known families of functions: the quadratics (see below) and the linear functions:
The n in a power function gives the highest power in the polynomial. It is called the order of the polynomial. The shape of a polynomial function is highly dependent on the order of the polynomial, since this determines the leading power function in the polynomial. The following general statements can be made:
If n is even, then the polynomial function does the same thing on both sides of the y-axis: it either rises up on both sides or drops down on both sides. If n is odd, then the polynomial does the opposite on both sides: one side will rise, the other will drop. The order also determines two other properties: the maximum possible number of times the polynomial crosses the x-axis (the number of zeros) and the number of time the graph changes direction (either from increasing to decreasing or vice versa):
- Maximum number of zeros = n
- Maximum number of turning points = n - 1
You may have seen the famous quadratic formula. This is a formula for finding the roots of a quadratic equation. Roots are places where the function crosses the x-axis, so these points all have y = 0. Thus, they are solutions to the equation:
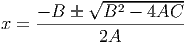
Using the quadratic formula, we can find the x-coordinates of these crossing points:
Most software can add quadratic trendlines to a graph; however, it refers to them by their more proper name as ”polynomials of order 2”.