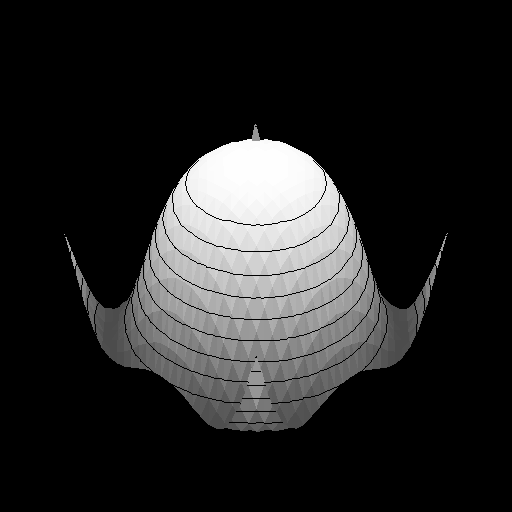
Suppose we have a surface plot of a function z = f(x,y).

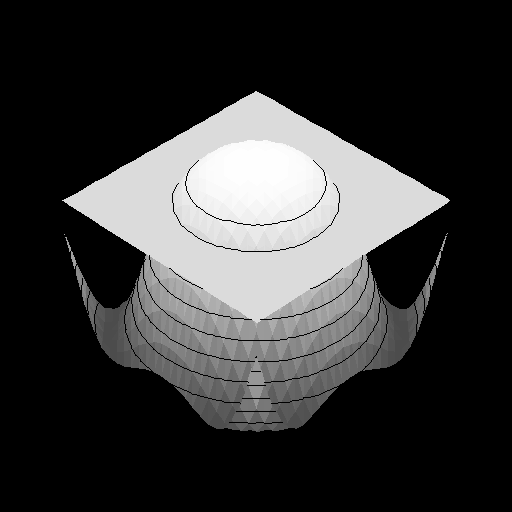
To get a contour of the function for z = c simply connect all the points at a height of z = c with a curve. Another way to view this is to think of the contour as the intersection of the surface with the plane z = c.

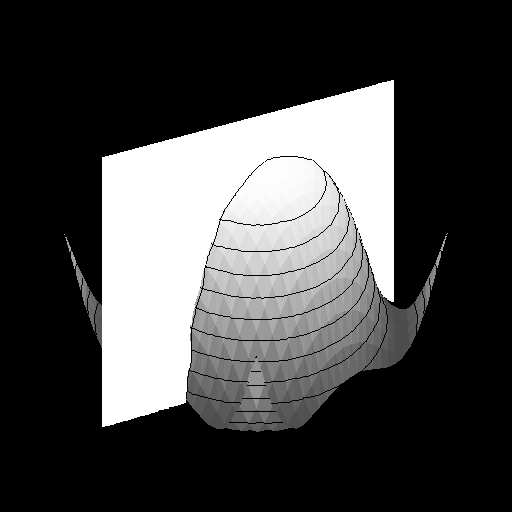
To get a section, we slice in the vertical directions and look at the intersection of the planes x = c or y = c with the graph of f(x,y).

You can try this on your own. Start with half of a large potato. Slice this half in slices that are parallel to the flat portion of the half (where you cut it in half to start with.) Trace the outline of each slice on a set of axes to create a contour plot. To create a sectioning, slice the potato in slices perpendicular to the original slice made to cut the potato in half. Trace the outlines of these slices to get a sectioning.