Mechanics and Techniques Problems
4.1. Download the data file C04 Salaries.xls [.rda]. This data represents salaries for employees
at a small company.
- Add in two new columns of computed data: The first column should contain the salaries
of each employee after a flat $1000 raise. The second column should contain the salaries
after a 5% raise.
- What are median and quartiles of these three different salaries? (Be sure to copy and
paste these statistics from your software).
- What happened to the median and quartiles after the $1000 increase? Why?
- What happened to the median and quartiles after the 5% increase? Why?
- Describe (in words) how you think the boxplots would look different from the original
boxplot for both (i) the fixed salary increase and (ii) the percent salary increase.
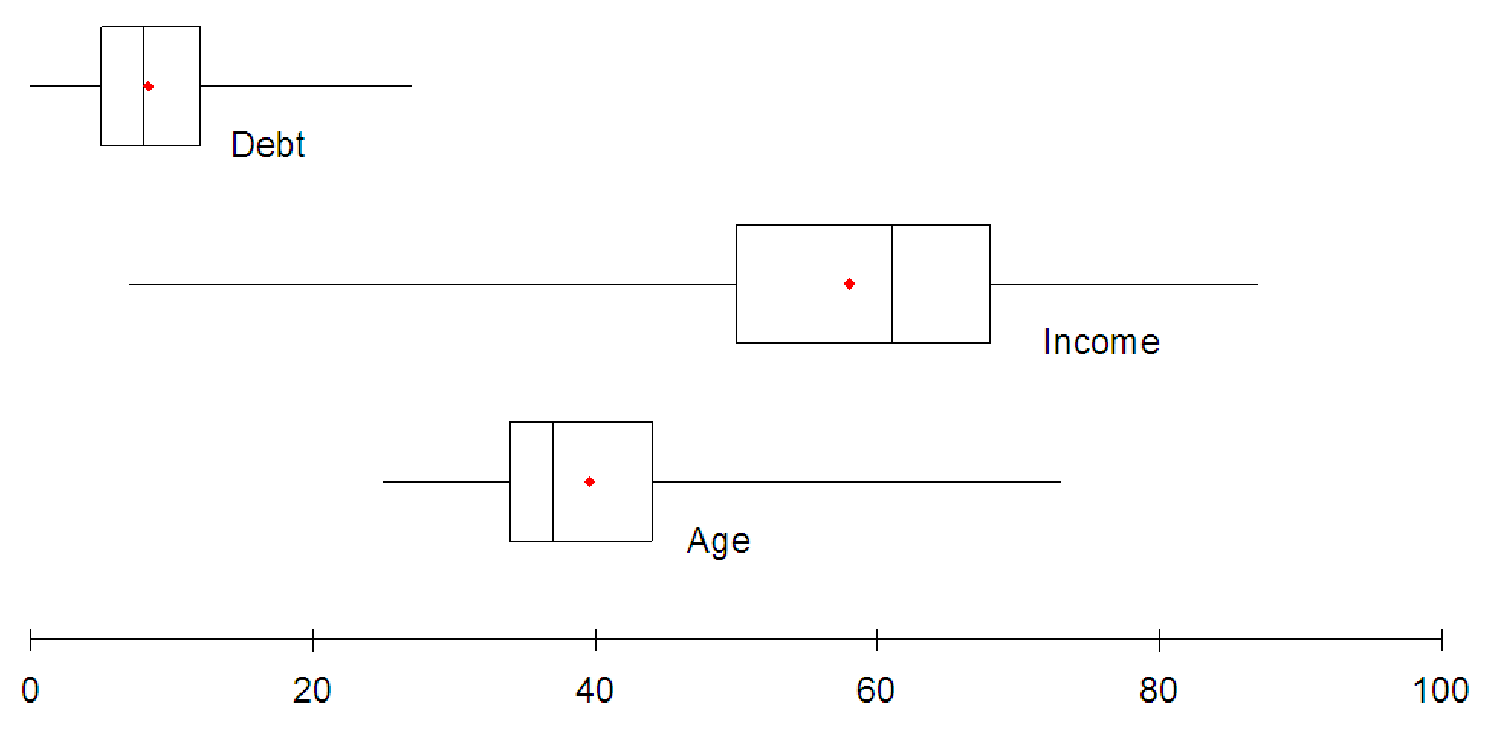
4.2. The boxplots below (figure 4.6) provide information about the people who tend to purchase
your company’s products. These data are reported as boxplots, one for the ages of the customers,
one for the incomes, and one for the typical monthly credit card debt the customers carry. Use
these boxplots to describe your typical customer. Make explicit reference to the quantities you can
read from the boxplot directly and use these to describe your company’s typical customer.
4.3. Consider the data shown in C04 MachineParts.xls [.rda]. This data shows the diameter of
1,000 rods manufactured on your company’s assembly line. The rods must be within
0.03 inches of being 0.50 inches in diameter to fit in the structure for which they are
made.
- Create a boxplot of this data. Determine how many data points are extreme outliers
and how many data points are mild outliers.
- Sort the original data and locate all the extreme outliers. Make a new column containing
all the data except these outliers. Make a boxplot of the data without the extreme
outliers.
- Are there any outliers in the reduced data from part b? If so, eliminate them and
redraw the boxplot. Continue doing this until there are no outliers in the data. (Hint:
This should take two more rounds of eliminating mild and extreme outliers.)
- Compare your final boxplot (with no outliers) to the original boxplot from part a.
What can you learn about the data?
- When reporting these data, should you include the outliers? Why or why not?