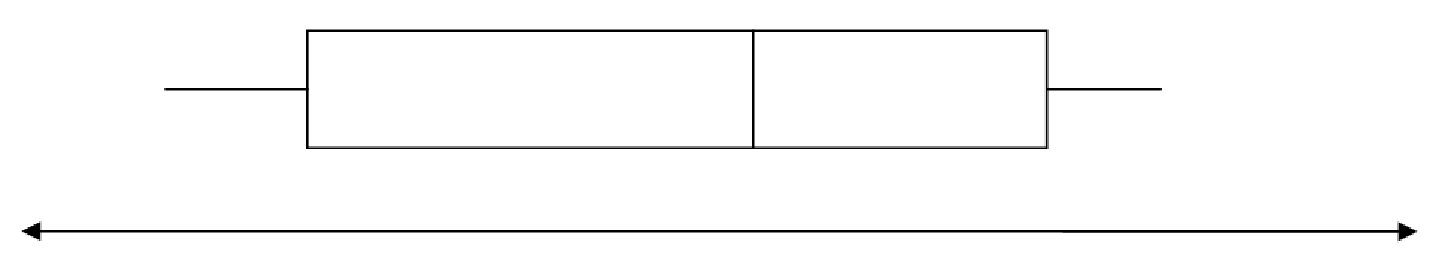
Figure 4.7: Boxplot for problem 4.
4.4. Place the data X1, X2, X3, X4, X5, X6, X7, X8, X9 along the horizontal axis of the boxplot in figure 4.7 so that it would produce a boxplot similar to the one shown. Assume that X1 < X2 < X3 < X4 < X5 < X6 < X7 < X8 < X9.
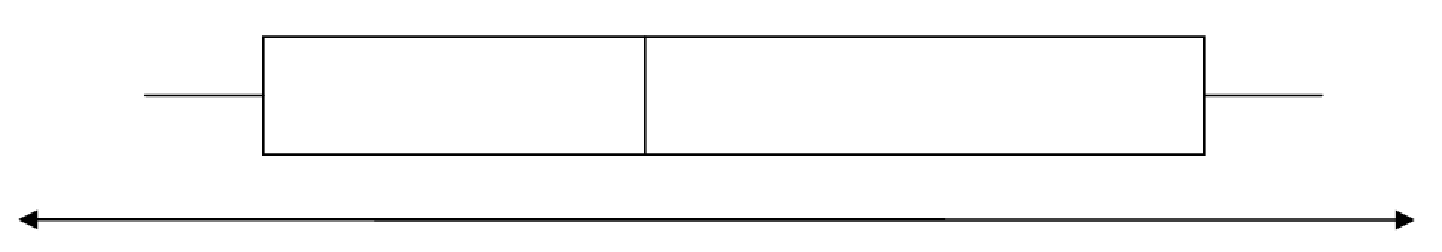
4.5. Place the data X1, X2, X3, X4, X5, X6, X7, X8 along the horizontal axis of the boxplot in figure 4.8 so that it would produce a boxplot similar to the one shown. Assume that X1 < X2 < X3 < X4 < X5 < X6 < X7 < X8.
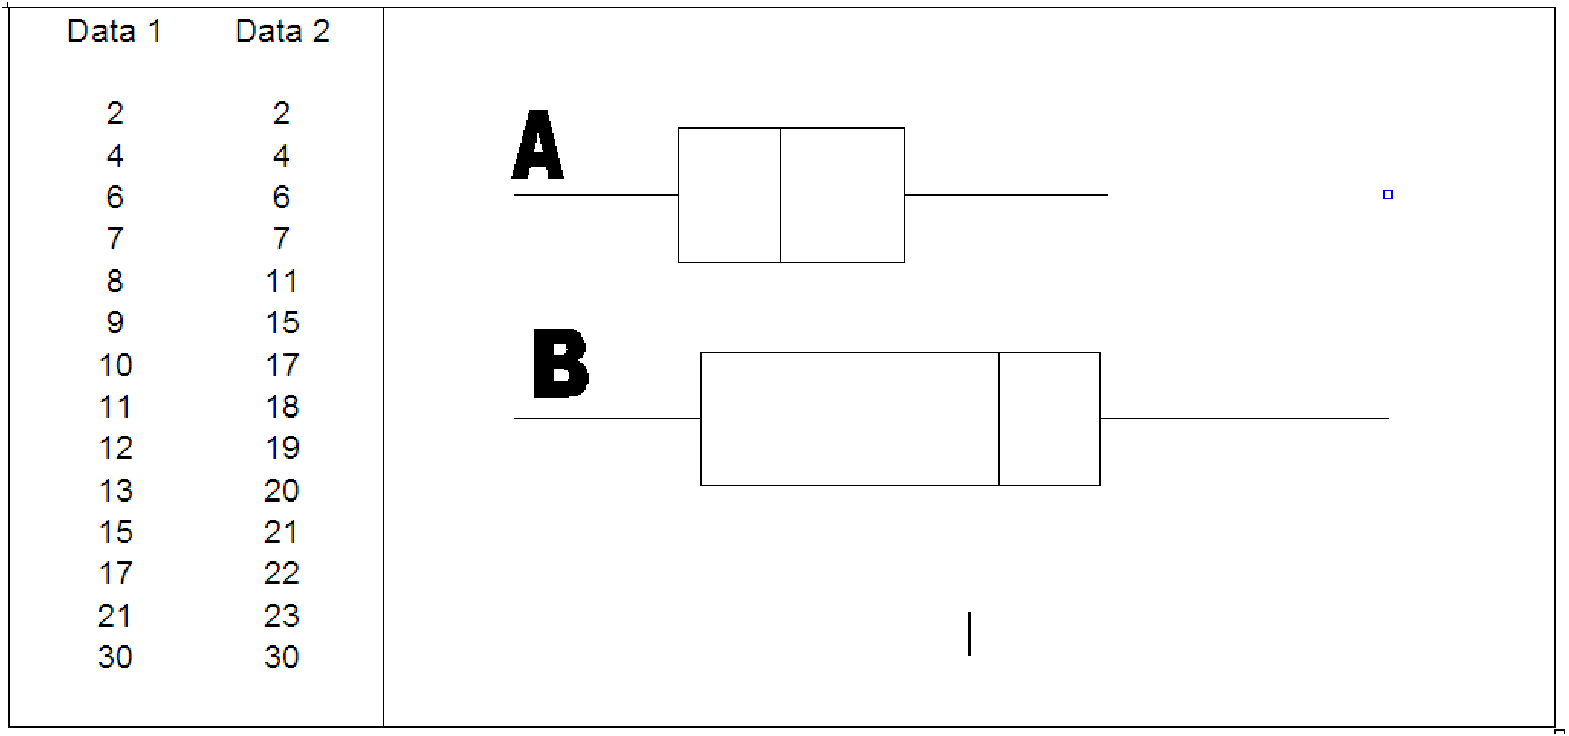
4.6. In figure 4.9, boxplot A represents the set Data 1 and Boxplot B represents the set Data 2. Given that the min and max of both data sets are the same answer the following questions:
4.7. Consider the data on baseball players in 1992 that is in data file C04 Baseball.xls [.rda]. We are interested in whether the salaries of players eligible to be free agents in 1992 were significantly different from the salaries of players who were not eligible to be free agents. Use software to make side-by-side boxplots of the stacked salary data, using the variable ”Free Agent Eligibility” as the code variable. Use your boxplot to explain whether being eligible to be a free agent has an effect on your salary. In your explanation, make use of all the statistics that the boxplots show you.
4.8. Consider the data and work you did in Mechanics and Techniques, problem 1.
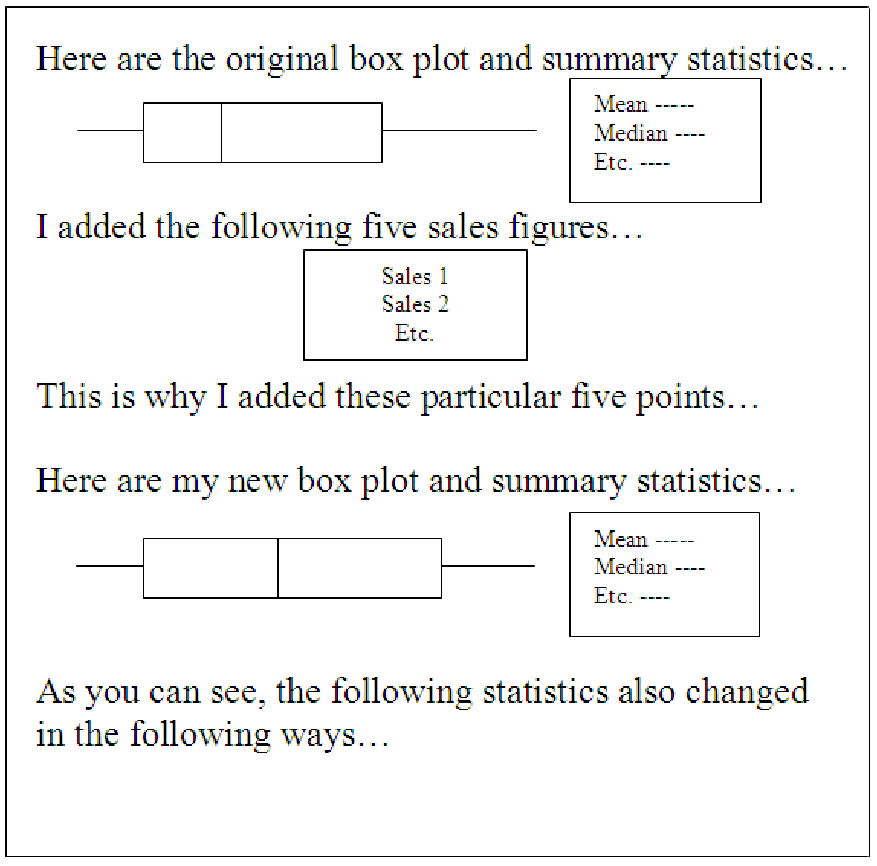
4.9. Download the data file C04 Sales.xls [.rda]. The data shows sales figures from sixteen stores in our chain. We have plans to open new stores in the following cities: Honolulu, HI; Little Rock, AR; El Paso, TX; Tucson, AZ; and Hartford, CT. Generate sales figures at the five new stores that will result in the mean sales of the company exceeding the median sales of the company. To answer this problem, add five new data points to make the mean of the new data larger than the median of the new data. To demonstrate to me that your new data satisfies this criterion, copy the five data points you added, show me the box plot and summary statistics for your new set of data, and explain your thinking process for selecting these five points. In order to explain your thinking process, be sure to provide a box plot and the summary statistics for the original data in order to compare.
Organize your report as shown in figure 4.10. (NOTE: The image below is just a sample. Your graphs will probably not look like the ones below.) In addition, explain what else changed when you added the five new data points.
Keep in mind that it is unrealistic for all five of the new stores to turn in exceptional sales figures. It is more likely that the five new stores will exhibit a wide range of sales figures, with most of them falling in the inter-quartile range.