One of our smaller clients, Dream Grills, sells its one product, the Dream Grill
5000, in two forms: assembled and unassembled. Based on economics theories about
substitute commodities, they have been making projections and analyses for their
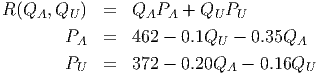
business plan based on the following models of their revenue.
In these models, the P and Q refer to the price and the quantity of the two items;
the subscripts A and the U refer to the ”assembled” and ”unassembled” versions of the
product. Thus, the quantity PA is the price of the assembled grills, based on the
quantities of each version that are sold.
The company has collected revenue and quantity sales data for the last 50 weeks.
Formulate a regression model for the revenue and compare the two models, yours and
theirs, using graphical and analytical tools you feel are appropriate to illustrate the
differences.
Attachments: Data File C13 Revenue.xls [.rda] To: Analysis Staff
From: Project Management Director
Date: May 29, 2008
Re: Revenue Projections at Dream Grills