17.2.3 Exploration 17B: Consumers’ and Producers’ Surplus at Market Equilibrium

  1. Bring up the file Exploration 17B.xls [.rda]. This file contains data from consumer and producer market surveys of a particular company’s products. Find the equations for the demand function and the supply functions.

    D(x) =

    S(x) =

  2. How do you find the point where market equilibrium occurs? (Hint: Use the difference of the demand and supply functions in Goal Seek as described in the How To Guide.)

    x =

    p =

  3. Compute the consumers’ and suppliers’ surplus at market equilibrium (x,p).
  4. Graph CS, PS, and p = p on the same axes where p is the equilibrium price (see the How To Guide).
  5. Suppose the figure below illustrates the consumers’ and producers’ surplus at market equilibrium of a different commodity than above. Sketch the horizontal line p = pL, where pL is the established price of a commodity that is lower than the equilibrium price p. What are the implications for the company in this situation?


    PIC


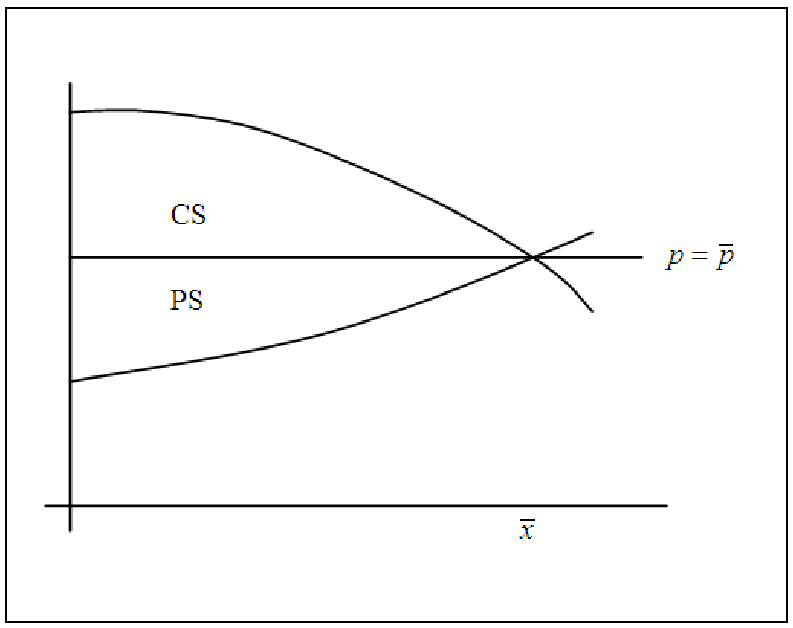
    Figure 17.8: Graph for exploring what happens if the established price is lower than market equilibrium.


  6. The figure below illustrates the consumers’ and producers’ surplus at market equilibrium. Sketch the horizontal line p = pH, where pH is the established price of a commodity that is higher than the equilibrium price p. What are the implications for the company in this situation?


    PIC


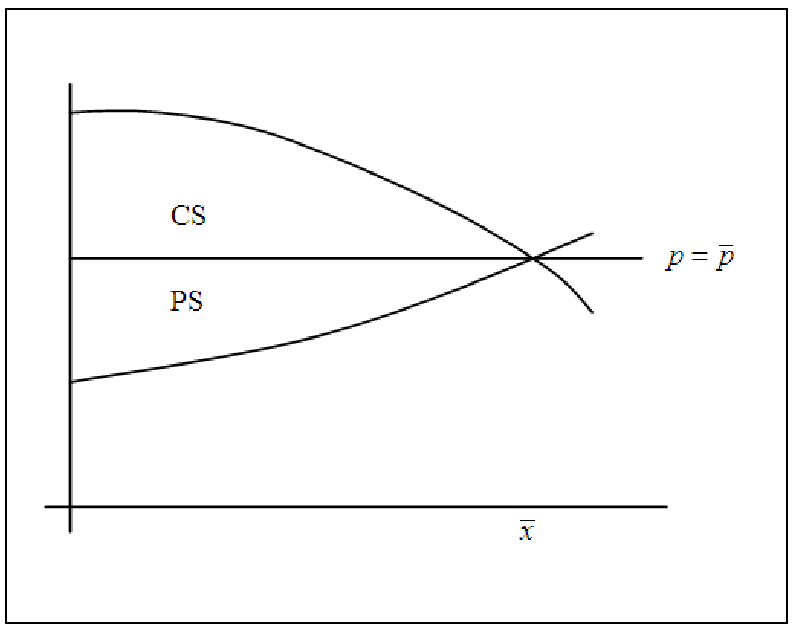
    Figure 17.9: Graph for exploring what happens if the established price is higher than market equilibrium.