The difference between the largest and smallest observations: Range = Maximum -
Minimum
Quartiles
These divide the data into four equal-sized groups of observations, based on an
ordered list of data from smallest to largest
First quartile (Q1)
The first quartile is the numerical value that exactly 25% of the
observations are less than or equal to.
Third quartile (Q3)
The third quartile is the numerical value that exactly 75% of the
observations are less than or equal to.
Interquartile Range (IQR)
The distance between the first and third quartiles: IQR =
Q3 - Q1. Exactly 50% of the data falls inside the IQR.
Outliers
These are data points that are not large enough or small enough to ”fit in” with
the other data. A mild outlier is an observation that is more than 1.5 IQR above Q3
or more than 1.5 IQR below Q1. An extreme outlier is an observation that is more
than 3 IQR above Q3 or more than 3 IQR below Q1
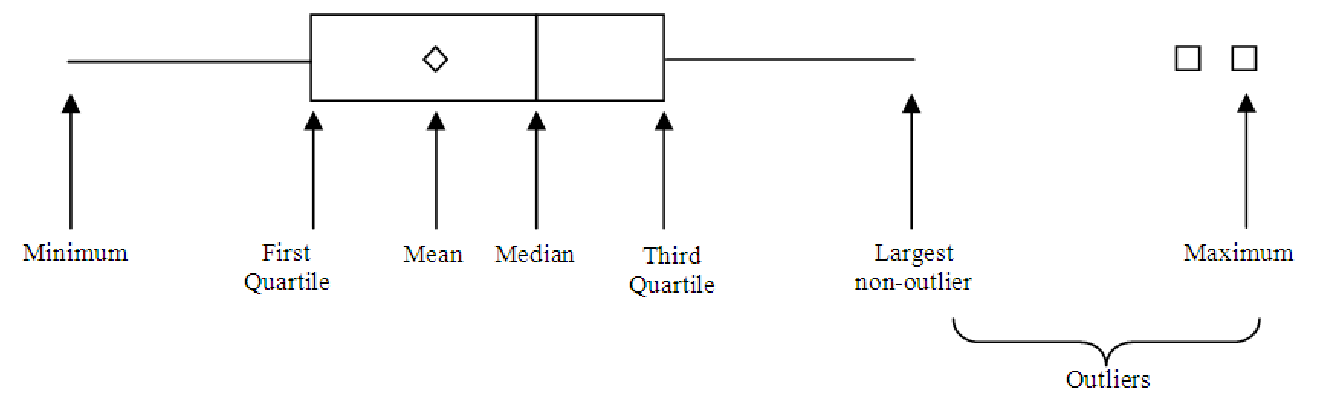
Boxplot
This is a graph of all the basic summary measures of a single variable. It combines
all of the above information, the mean, and the median. It is sometimes called a
box-and-whisker plot. A sample plot is shown below.
Figure 4.1: Sample boxplot (without scale) showing the major features. Note that any
outliers appear past the end of the whiskers.