6.1.1 Definitions and Formulas

Summarized Data
Summarized data is data not presented in raw form. Instead, the data has been grouped (or summarized) into categories. For example, rather than listing the salaries of all 250 employees at a company, a summarized presentation of this data might simply tell you the number of employees in each salary range, such as 10 employees making $0 - $20,000, 34 employees making $20,001 to $40,000 and so forth.
Weighted Average
A weighted average is a type of mean where each item to be included in the average has a different weight depending on either its frequency or importance. One of the most common weighted averages is a student’s GPA in college. Each class is assigned a value, based on the grade (usually a number from 0 - 4 quality points) and is assigned a weight based on the number of credit hours (3 for a three credit course, 4 for a 4 credit course, etc.) The overall GPA is then computed by weighting each grade (multiply the quality points by the weight [number of credit hours]), adding these weighted grades up, and dividing by the total number of credit hours (which is just the sum of all the weights). This means that a low grade in a high weight course (one with more credit hours) is more damaging than a low grade in a course with few credit hours. Another common use of weighted averages is to estimate the mean of a set of data given by a frequency table. In this case, the weight is determined by the frequency counts. For example, if 10% of a class scored 50 on an exam, 20% scored 60, 40% scored 70, 10% scored 80 and 20% scored 90, then the class average is
0.10(50) +-0.20-(60) +-0.40(70-) +-0.10(80)-+-0.20(90) = 71-= 71.
          0.10 + 0.20 + 0.40 + 0.10 + 0.20              1

More generally, if the data are given by xi and the weights are given by wi, the weighted average of the data is given by

                     ∑n   w x
Weighted  Average =  -∑in=1--i-i
                        i=1 wi

Weight
Each item to be included in a weighted average is assigned a weight that identifies how much that item contributes to the overall average. The weight assigned to the ith piece of data is commonly denoted by the symbol wi.
Estimated Mean
When computing the mean of data that is given only by frequency tables, we cannot compute the actual mean since we only know the number of data points falling into each range of the frequency table. We must estimate the value for the data in each bin of the table, which results in an overall estimate of the mean. Estimated means from frequency data are computing by using the formula for the weighted average, with the weights given by the frequency counts (the number of pieces of data in the bin). The symbol xest will be used to represent the estimated mean.
Estimated Standard Deviation
Estimating the standard deviation from frequency data is similar to the process of estimating the mean, but involves a few more steps. First, of course, we need to estimate the mean of the data. Now, if each of the data points (or central points of each bin in the data, more precisely) is denoted by xi and the frequency (number of items in that bin of the frequency table) is given by wi, then the estimated standard deviation is
    ┌ -------------------
    ││ ∑ni=1wi (xi - ¯xest)2
S = ∘ ----∑n-------------
         (  i=1 wi) - 1

Note that the sum of all the weights

∑n
   wi = w1 +  w2 + ...+ wn =  n = Total number  of data points.
i=1

Sumproduct
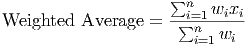
Another way to think of weighted averages is to think of lining up the data in one column and the weights in another column. By multiplying line-by-line, we find the contribution of each item to the weighted average. Adding these contributions results in calculating the top part of a weighted average. In Excel, the SUMPRODUCT function takes two lists (one is data, one is weights) and carries out this computation. This is equivalent to thinking of the items as a vector and the weights as a vector and computing the vector dot product or scalar product.

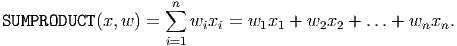
If the two lists are given by x = (x1,x2,,xn) and w = (w1,w2,,wn), the scalar product or SUMPRODUCT of these two lists is simply

                     ∑n
SUMPRODUCT  (x,w ) =    wixi = w1x1 + w2x2  + ...+ wnxn.
                     i=1