Percentiles are similar to quartiles, except that the data is broken into one
hundred pieces, rather than four. For comparison, the first quartile is the same as the
twenty-fifth percentile, since one-fourth of 100 is 25. The median is the same as the
50th percentile, and the third quartile is the same as the 75th percentile. Percentiles
are often used to break the data down even further than is possible with quartiles. The
strict definition of the nth percentile is that it is the observation below which n% of
the data falls. Thus, 90% of the data is less than the 90th percentile and 99% of the
data is less than the 99th percentile.
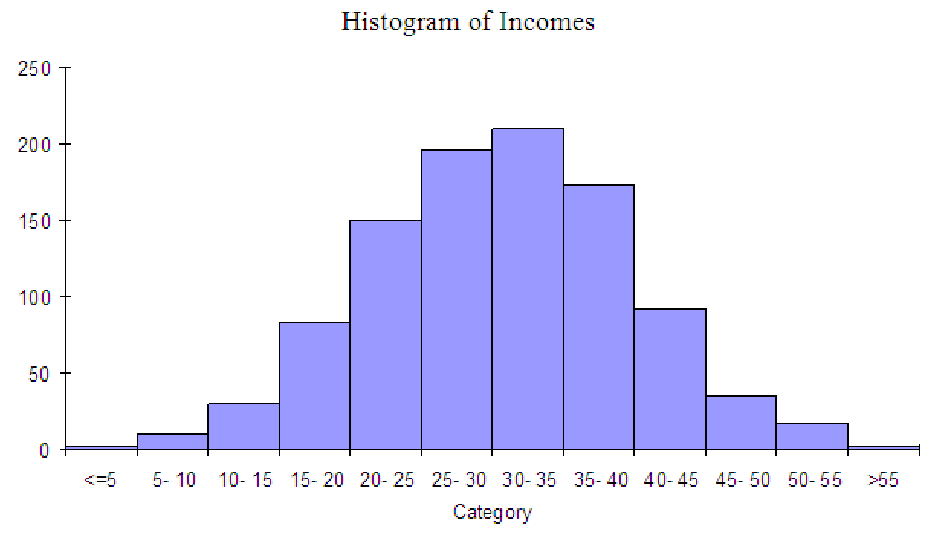
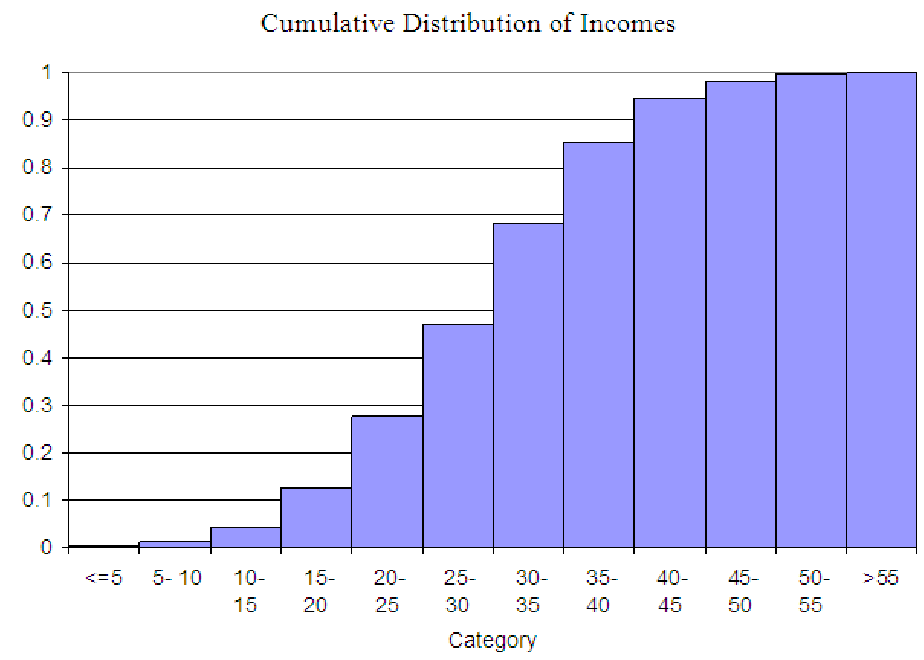
Cumulative Distribution
Cumulative distributions are similar to histograms. However,
each bin in a cumulative distribution includes all of the observations in the bins to the
left of the bin as well. Usually, the number of observations in each bin is expressed as
a percentage of the total number of observations so that the right-most bin will have
100% of the observations in it.