 |  |
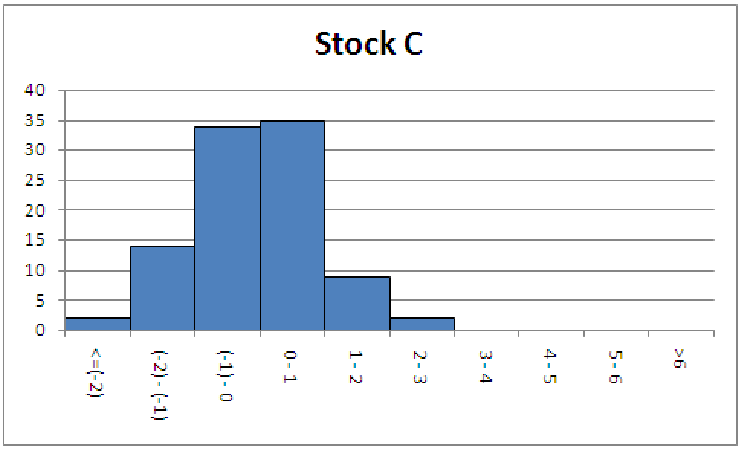 | 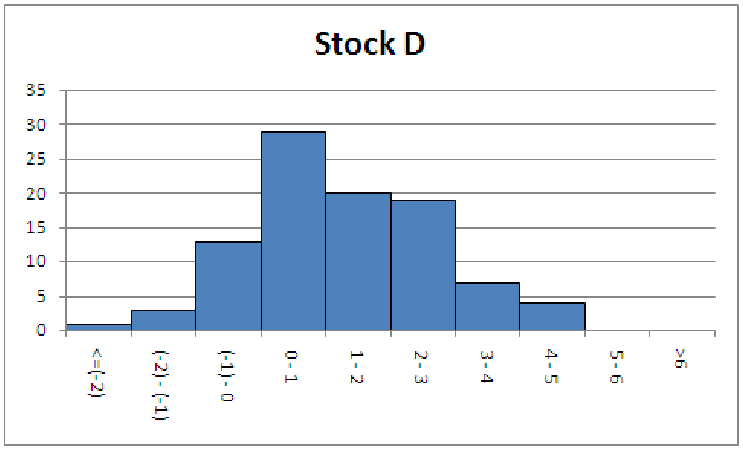 |
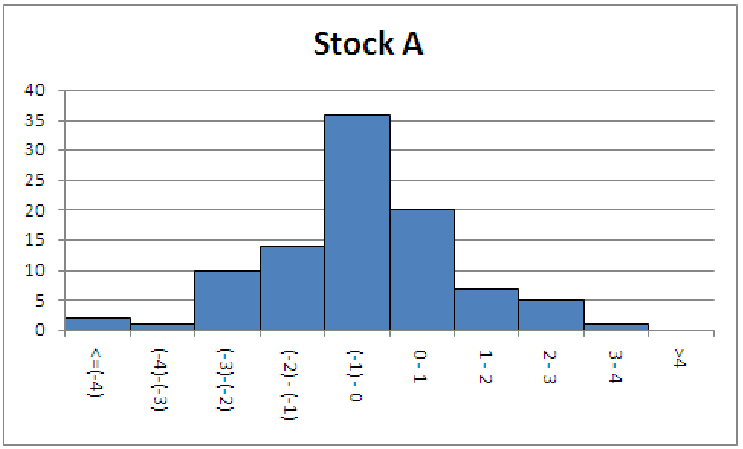
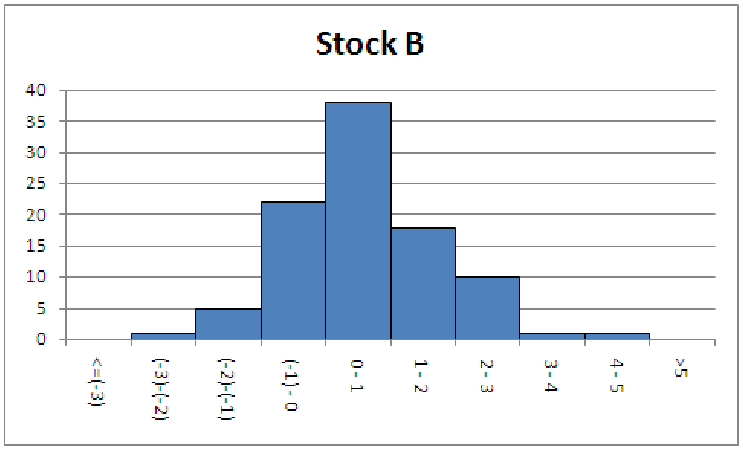
Figure 6.9: Graphs for Exploration Stock Investment Decisions
You have just started working for a new company, Impressive Business Machinery. As part of the paperwork for your hiring, you have been asked to choose an investment stock for your retirement planning. Your employer offers you four choices and provides you with histograms (figure 6.9) of the daily returns for these stocks over the last 3 months. (You suspect that your employer is testing you, but you can’t be sure.) For the near future, which of these stocks would you choose? Why would you choose that stock? How will you justify your decision to your family if it does not perform as well as expected?
It may be helpful to sketch the cumulative distribution and a boxplot for each of the stocks. Each graph contains 96 observations (about three months worth of data). It will also be helpful to rank the four stocks from highest to lowest in terms of both the mean and the standard deviation.
| Statistic | Highest | Med-High | Med-Low | Lowest |
| Mean | ||||
| Standard Deviation | ||||
| Minimum | ||||
| First Quartile | ||||
| Median | ||||
| Third Quartile | ||||
| Maximum | ||||