7.2.1 Definitions and Formulas

Slope
The slope of a straight line is a number that tells you exactly how much the dependent variable will increase for a given increase in the independent variable. Usually it is represented as a decimal number or a fraction and it is calculated from looking at the ”rise” of the straight line between two points (this is the vertical distance between them) and comparing this to the ”run” (the horizontal distance separating the two points). If the two points are labeled (x1,y1) and (x2,y2) then the slope is the change in y divided by the change in x. (Note that the Greek symbol delta, Δ, represents the phrase ”change in”.)
         Δy    y2 - y1
Slope = ----=  --------
        Δx     x2 - x1

Y-intercept
The y-intercept is the position on the vertical axis (possibly not shown on the graph) where a straight line crosses.
Equation of a straight line
The most common way to represent the equation of a straight line is in slope-intercept form:
y = A +  Bx.

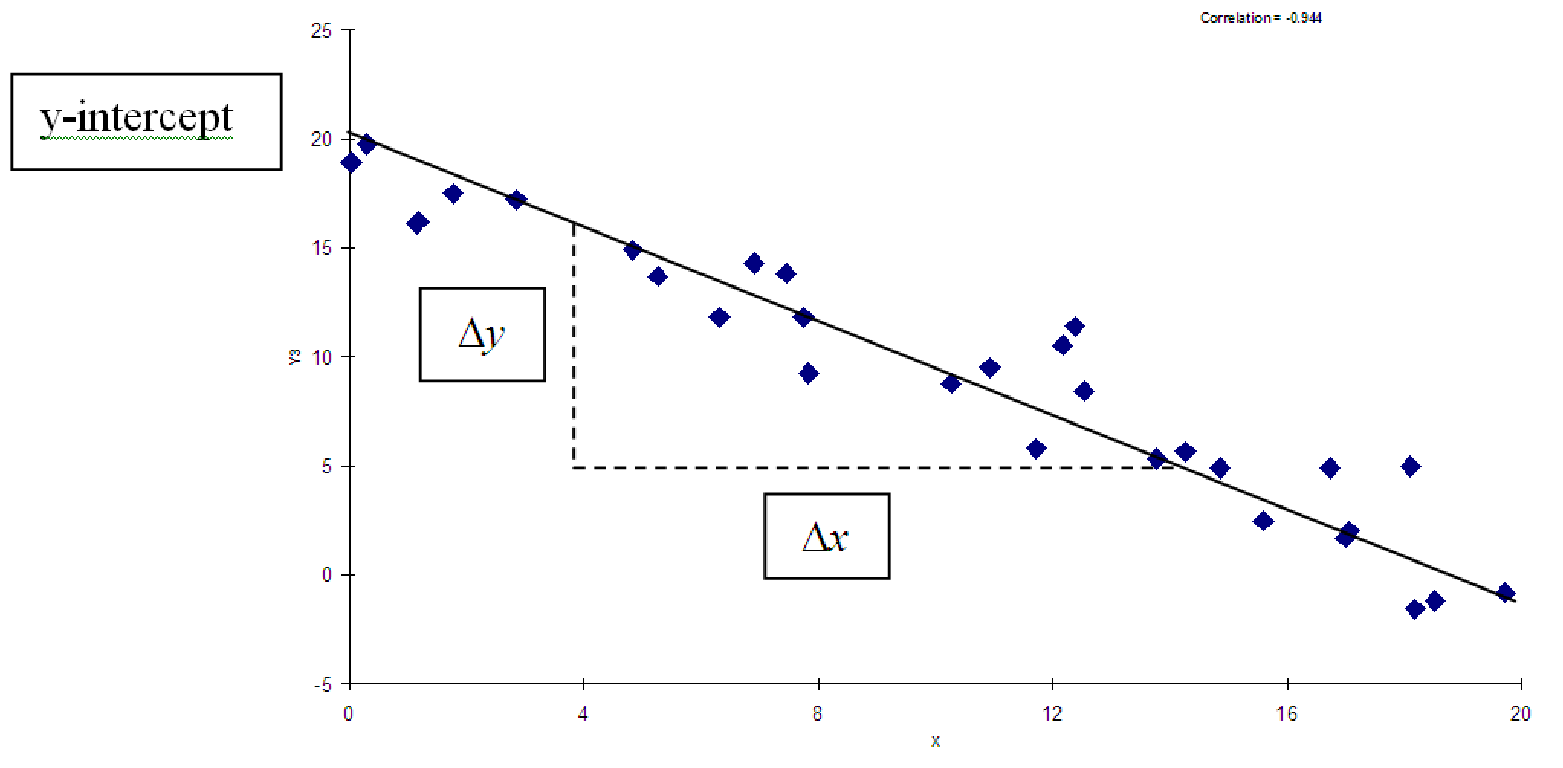
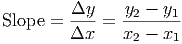
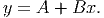
In this equation, A is the y-intercept and B is the slope. The two other letters represent the variables: x is the independent variable, y is the dependent variable.

The equation can also be represented in point-slope form:

y - y = B (x - x ).
     1           1

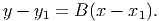
where B is again the slope and (x1,y1) is a point on the line. Both forms are equivalent; they are simply written in a different form to make it easier to use one or the other, depending on which two pieces of information you have. For example, if you re-arrange the point-slope form, you can produce y = Bx + (y1 - Bx1), showing that the y-intercept A = y1 - Bx1.

Trendline
A trendline is a line drawn on a graph to represent the relationship between two variables. These trendlines can take many forms. In most software, there are five basic trendline options: linear, exponential, logarithmic, power, and polynomial. Trendlines are also called lines of best fit, even though trendlines are not always straight lines. Perhaps they should be called curves of best fit or trendcurves?
Linear relationship
A linear relationship between two variables is characterized by a constant slope. A scatterplot of the two variables looks like a straight line. The graph in figure 7.13 shows a linear relationship, a linear trendline for it, and the slope and y-intercept of that trendline.
Function
A relationship between two variables (called the independent and dependent variables) in which every value of the independent variable is associated with one and only one value of the dependent variable. Functions can be represented graphically (as lines or curves on a set of axes), as a table showing sample values, by an equation, or by a verbal description in words. On a graph, the test of whether a relationship is represented with a function is called the vertical line test and consists of drawing vertical lines on the graph. If any line crosses the graph more than once, the relationship is not a function.


PIC


Figure 7.13: Sample linear relationship showing y-intercept and slope.