7.2.3 Exploration 7B: Adding Trendlines
Part I. Using data file C02 Homes.xls [.rda], answer each question below.
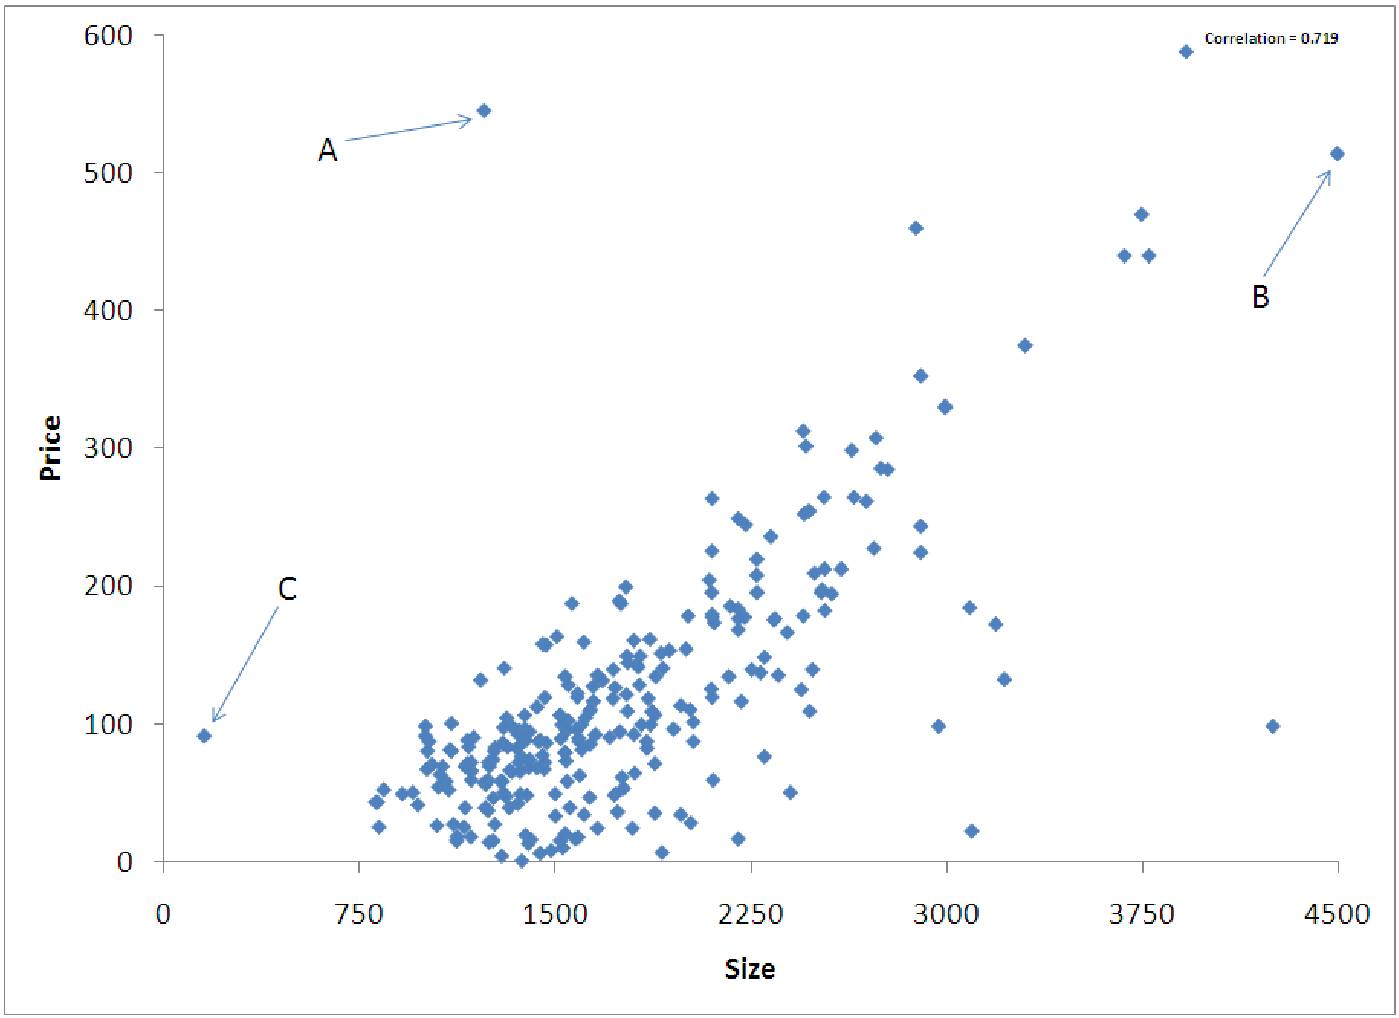
- Create a scatterplot of SIZE and PRICE, as you did in the earlier exploration in this
chapter. Add a trendline to it. Sketch the trendline here.
- Visually, how well does the trendline fit the data? Are there any points that seem to have
undue influence on the trend or not follow the trend well?
- What is the correlation coefficient (r) for this relationship? How does this compare with the
visual evidence you considered?
- Estimate the equation of the trendline for the relationship between the SIZE and PRICE of a
home?
Part II. Create a new scatterplot between PRICE and TAXES. Be sure to do the following:
- Modify the font size
- Add units to both axis labels
- State the trendline equation in terms of the Model Variables
- Add a trendline
- Visually, how well does the trendline fit the data? Are there any points that seem to
have undue influence on the trend or not follow the trend well?
- What is the correlation coefficient (r) for this relationship? How does this compare
with the visual evidence you considered?
- Estimate the equation of the trendline for the relationship between the PRICE and
TAXES of a home?