 |  |
| Histogram A. | Histogram B. |
 |  |
| Histogram C. | Histogram D. |
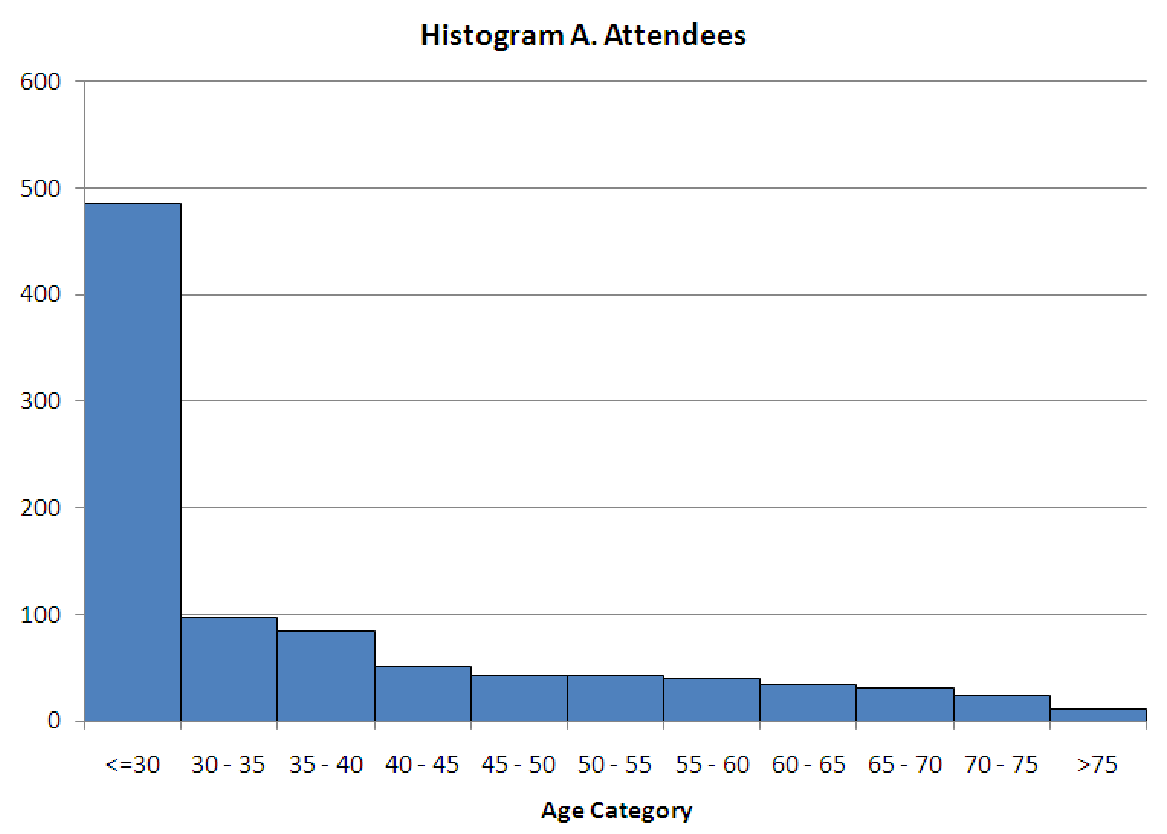
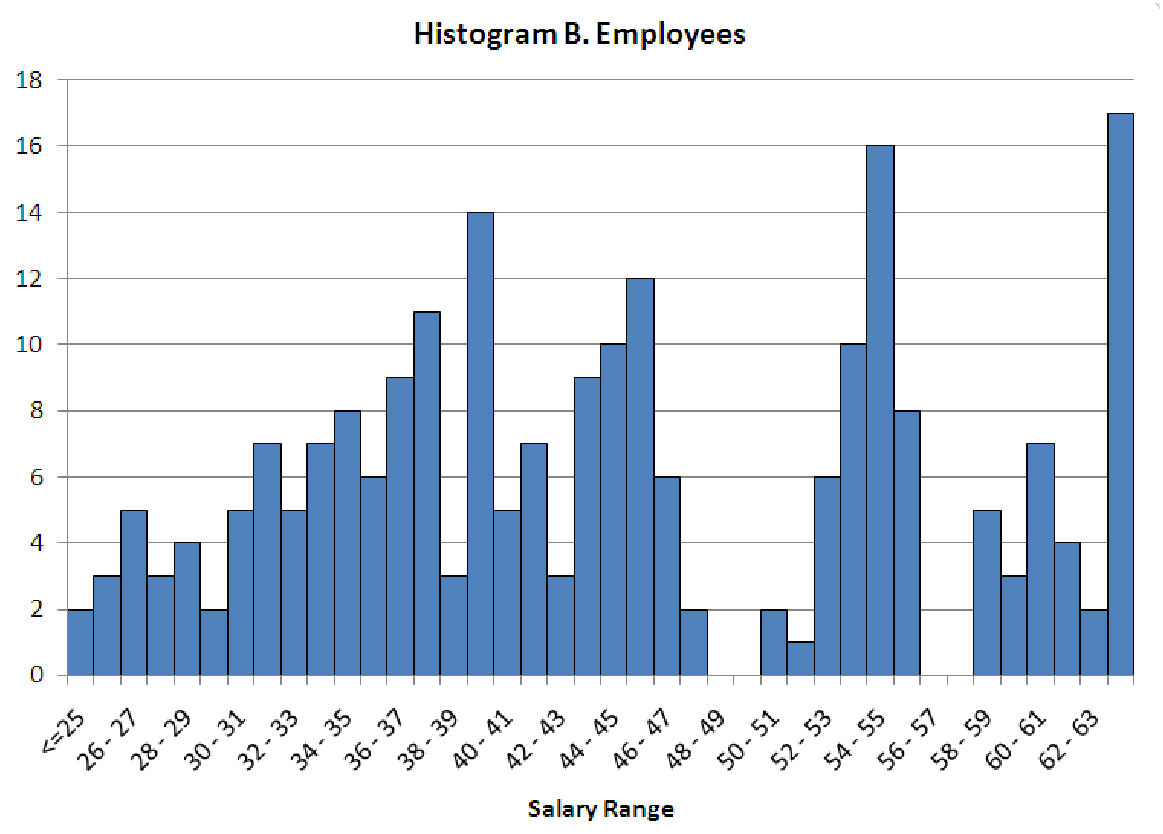
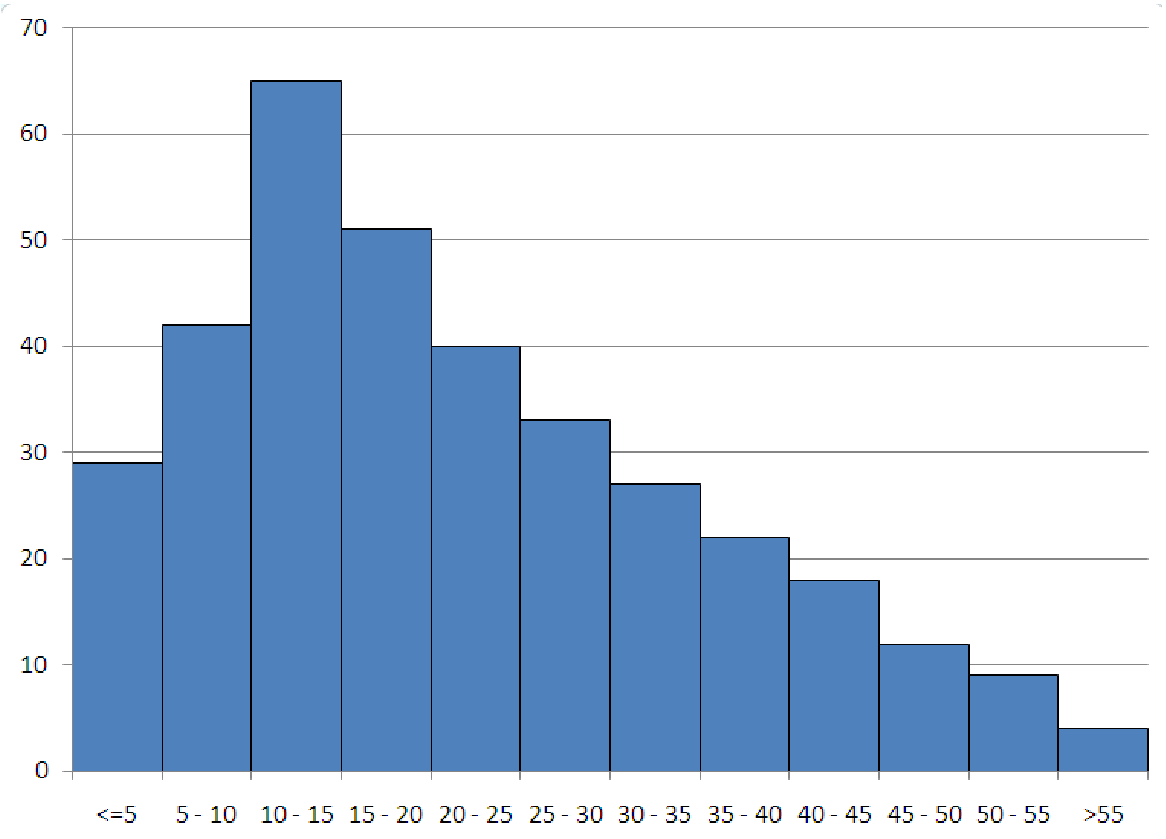
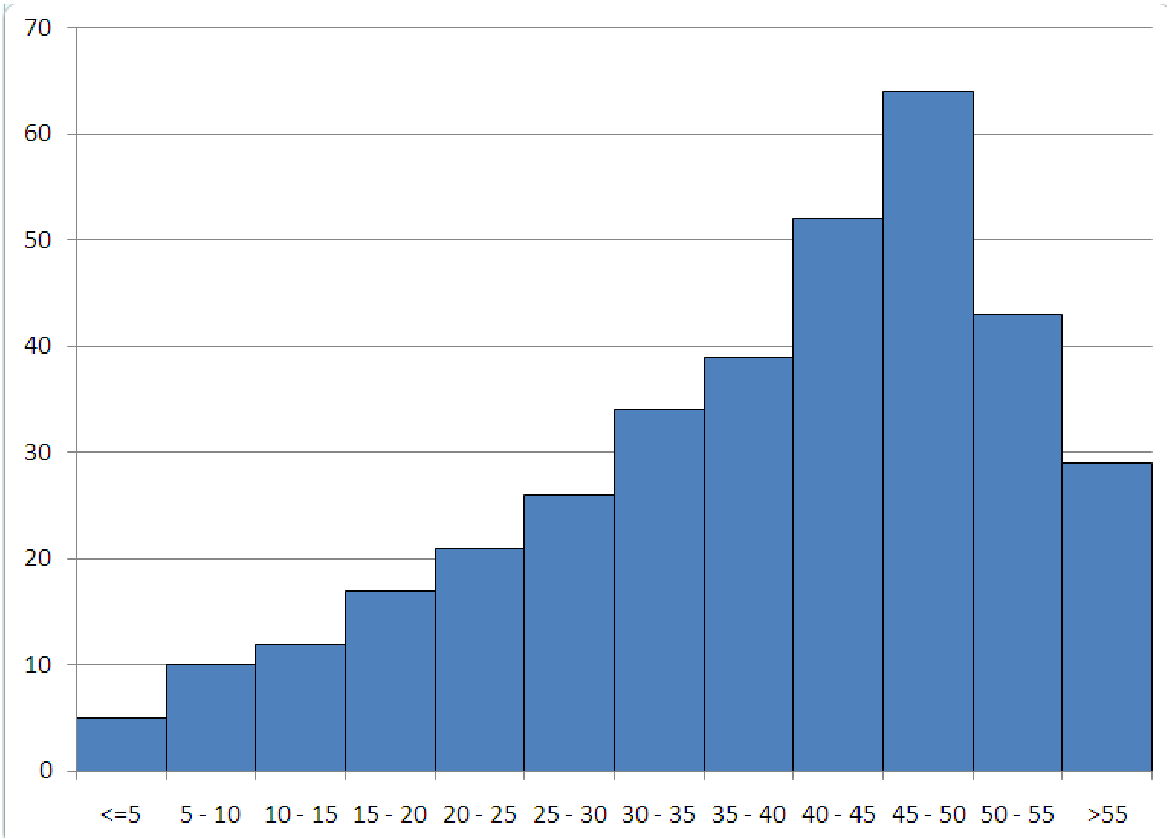
Figure 5.7: Histograms for Mechanics and Techniques problem 2.
5.1. The data file C05 Homes.xls [.rda] contains data on 275 homes that sold recently in the Rochester, NY area. Included in the data are observations of the location of the home, the annual taxes, the style of the home, the number of bedrooms, the number of bathrooms, the total number of rooms, the number of cars the garage will hold, the year in which the house was built, the lot size, the size of the home, the appraised value of the home, and the sale price.
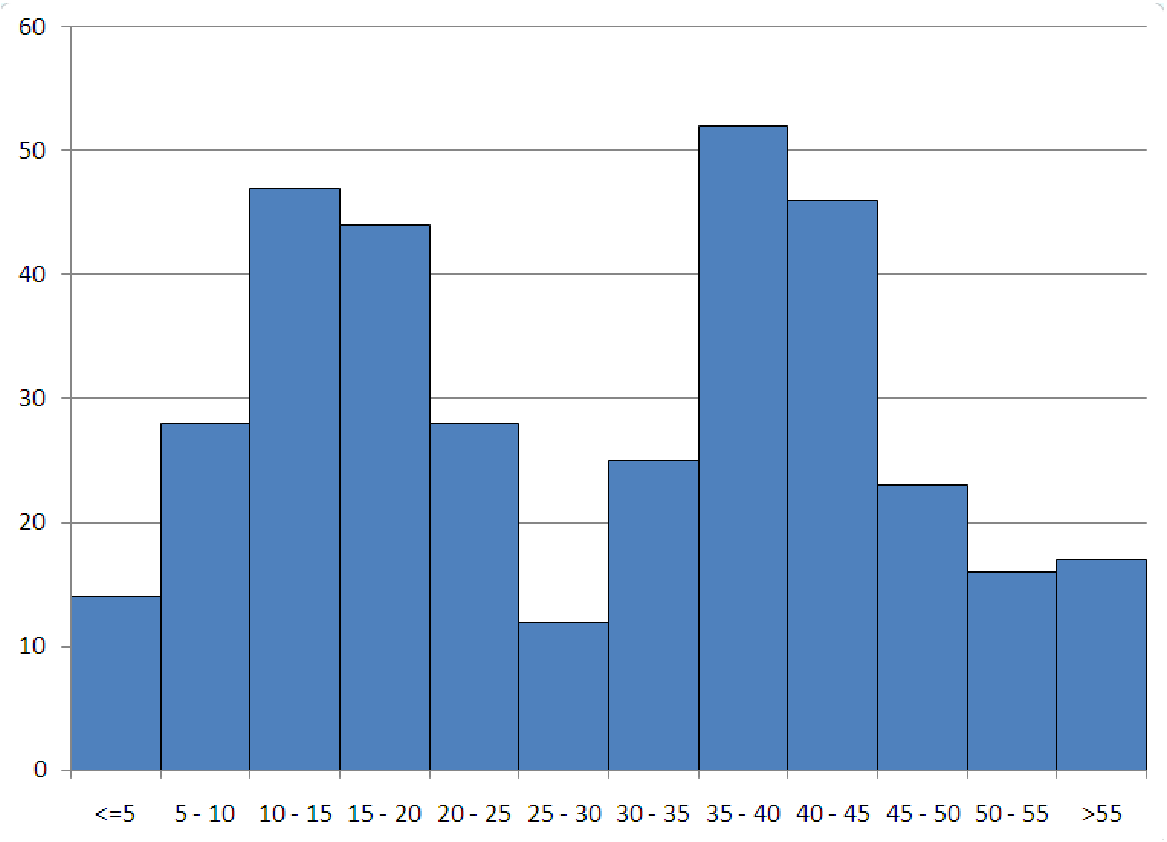
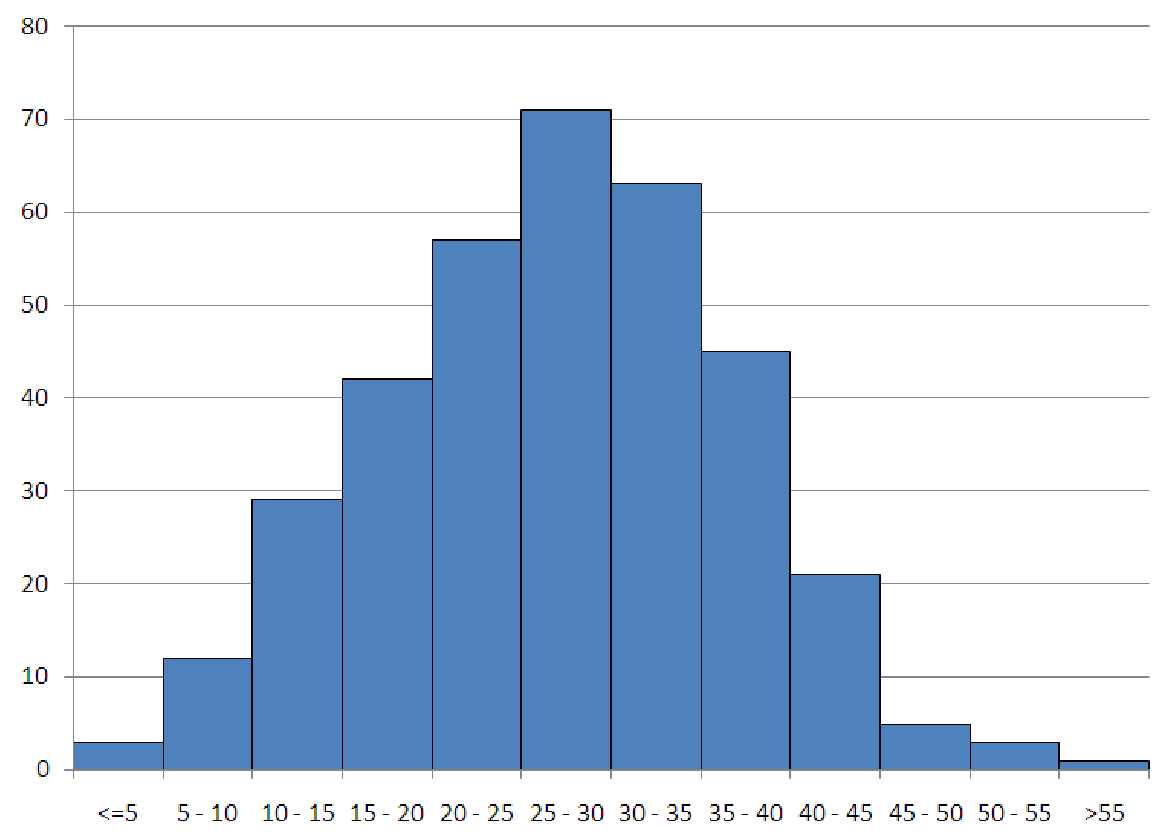
5.2. Consider the four histograms in figure 5.7 (labeled A - D). For each histogram, describe the shape.
| | |
| Histogram A. | Histogram B. |
| | |
| Histogram C. | Histogram D. |
5.3. Suppose you know that the mean of a set of data is 207.8 and the standard deviation is 43.2. If the median has a Z-score of -0.85, what is the median of this data?
5.4. Figure 5.8 shows two histograms. Histogram A represents the ages of people attending a recent event; histogram B represents the salary ranges of employees at a company. Each of these histograms could be improved in order to provide a better picture of the underlying data. For each, explain why the given histogram is less-than-ideal, and explain what you would do to improve it. In other words, how would you go about making a better histogram?