6.1. Consider the summarized frequency data found in file C06 Deliveries.xls [.rda]. This shows data on the unloading times for trucks at StateEx, both broken down by truck type (Semi or Van) and overall.
6.2. EverythingRUs is an extremely diversified company, manufacturing and distributing goods as well as providing a variety of services. The table below shows the mean monthly revenue and mean monthly cost for each sector of the company, along with the percentage each sector occupies in the overall revenue and cost structure. Use this information to estimate the mean monthly revenue and mean monthly cost for the entire company. All revenue and cost figures are in thousands of dollars.
| Sector | Mean Monthly | % of Total | Mean Monthly | % of Total |
| Revenue | Revenue | Cost | Cost | |
| Food services | $1,200 | 15% | $380 | 22% |
| Repair services | $2,460 | 18% | $115 | 6% |
| Security services | $875 | 11% | $219 | 10% |
| Health and beauty products | $1,620 | 14% | $652 | 17% |
| Automobile parts | $565 | 8% | $95 | 12% |
| Clothing | $3,218 | 13% | $1,897 | 15% |
| Medical supplies | $1,979 | 21% | $934 | 18% |
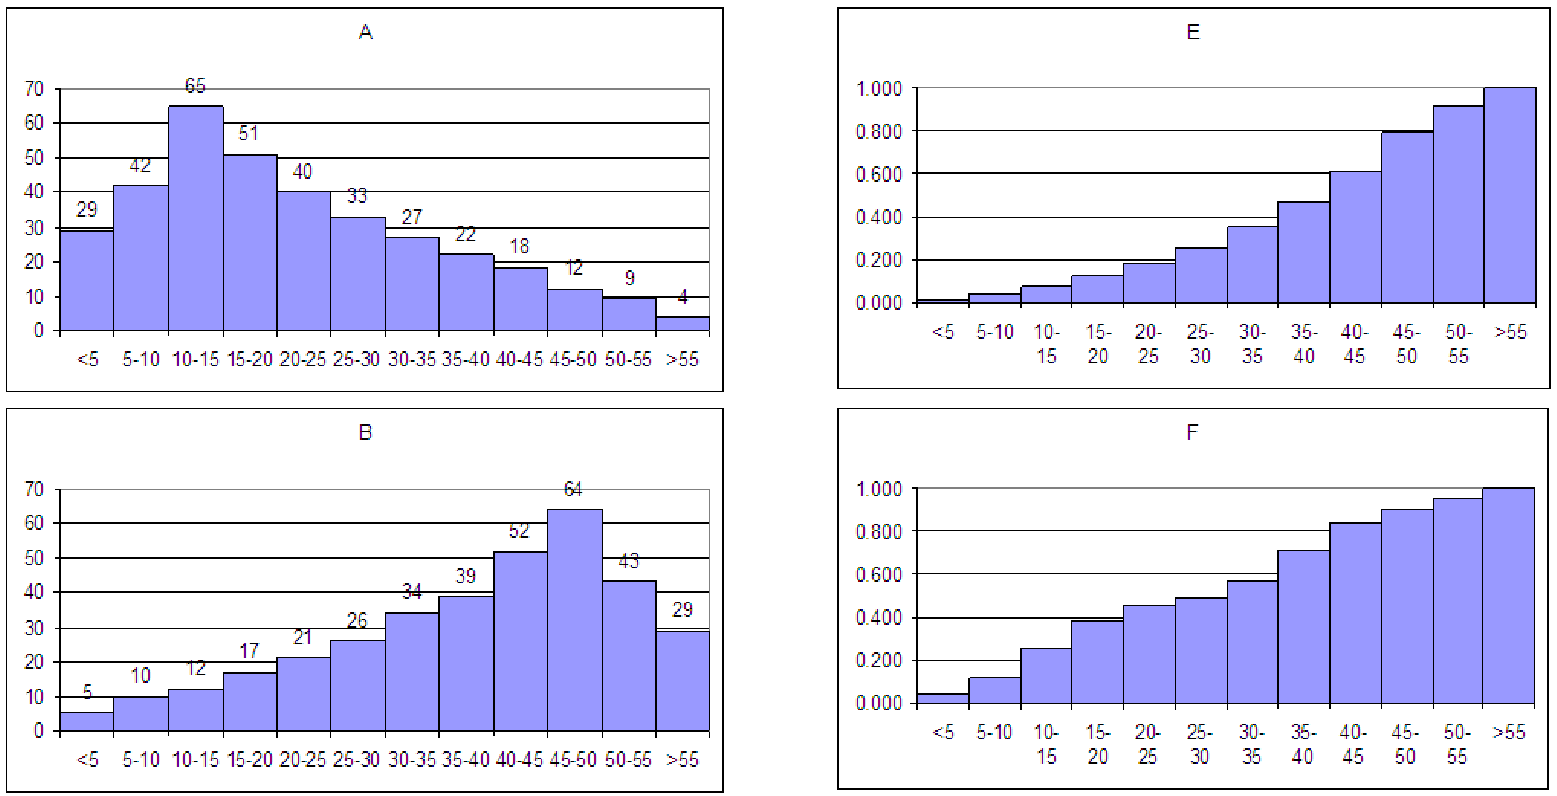
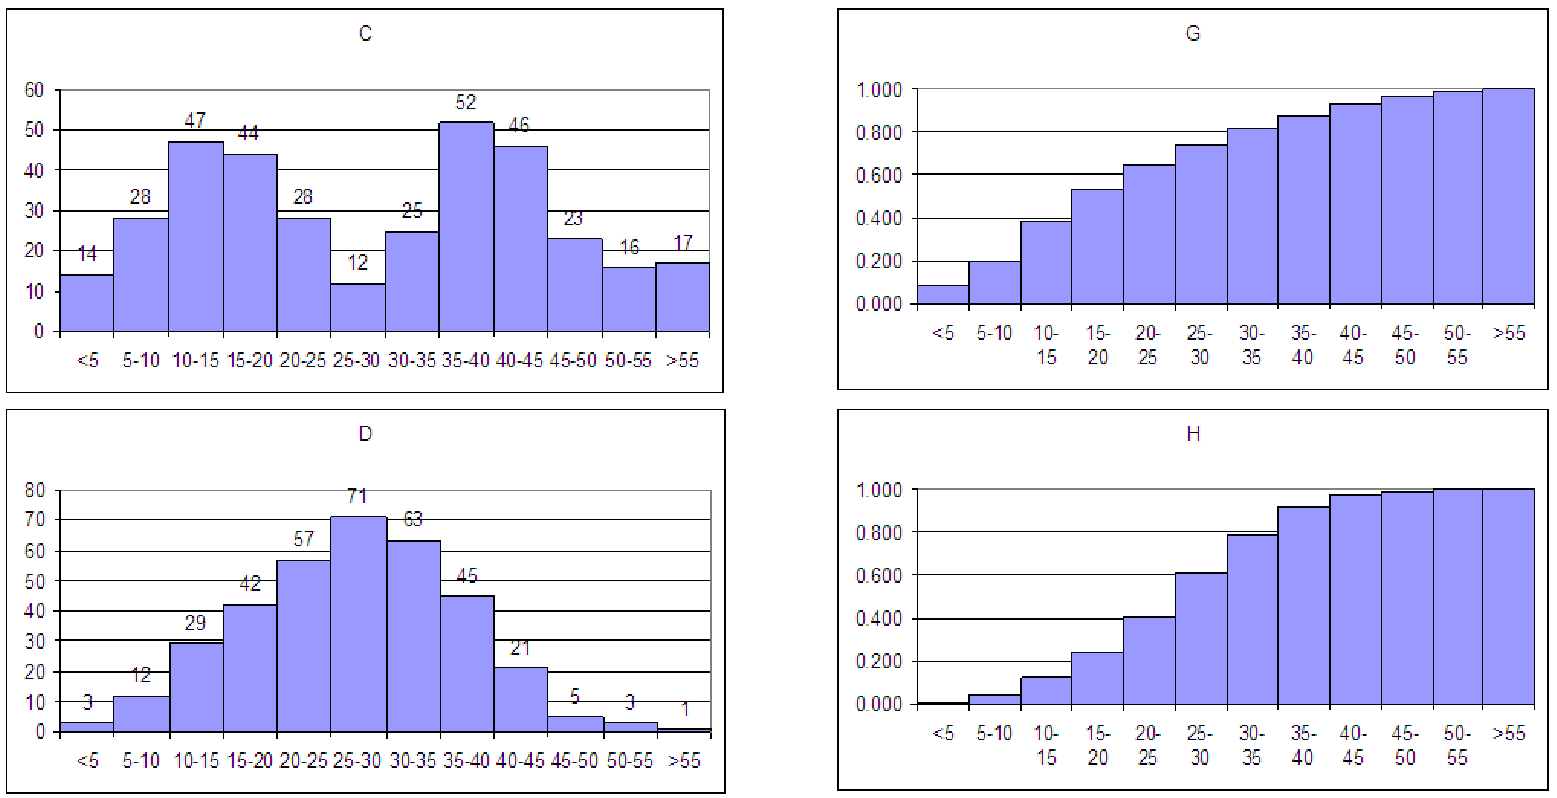
6.3. Match the histograms below with their cumulative distributions shown in figure 6.10. The graphs in the left-hand column (labeled A - D) are histograms. The graphs in the right-hand column (labeled E - H) are cumulative distributions. Each histogram contains the same number of total observations. The cumulative distributions are given by percentage of total, rather than actual count.
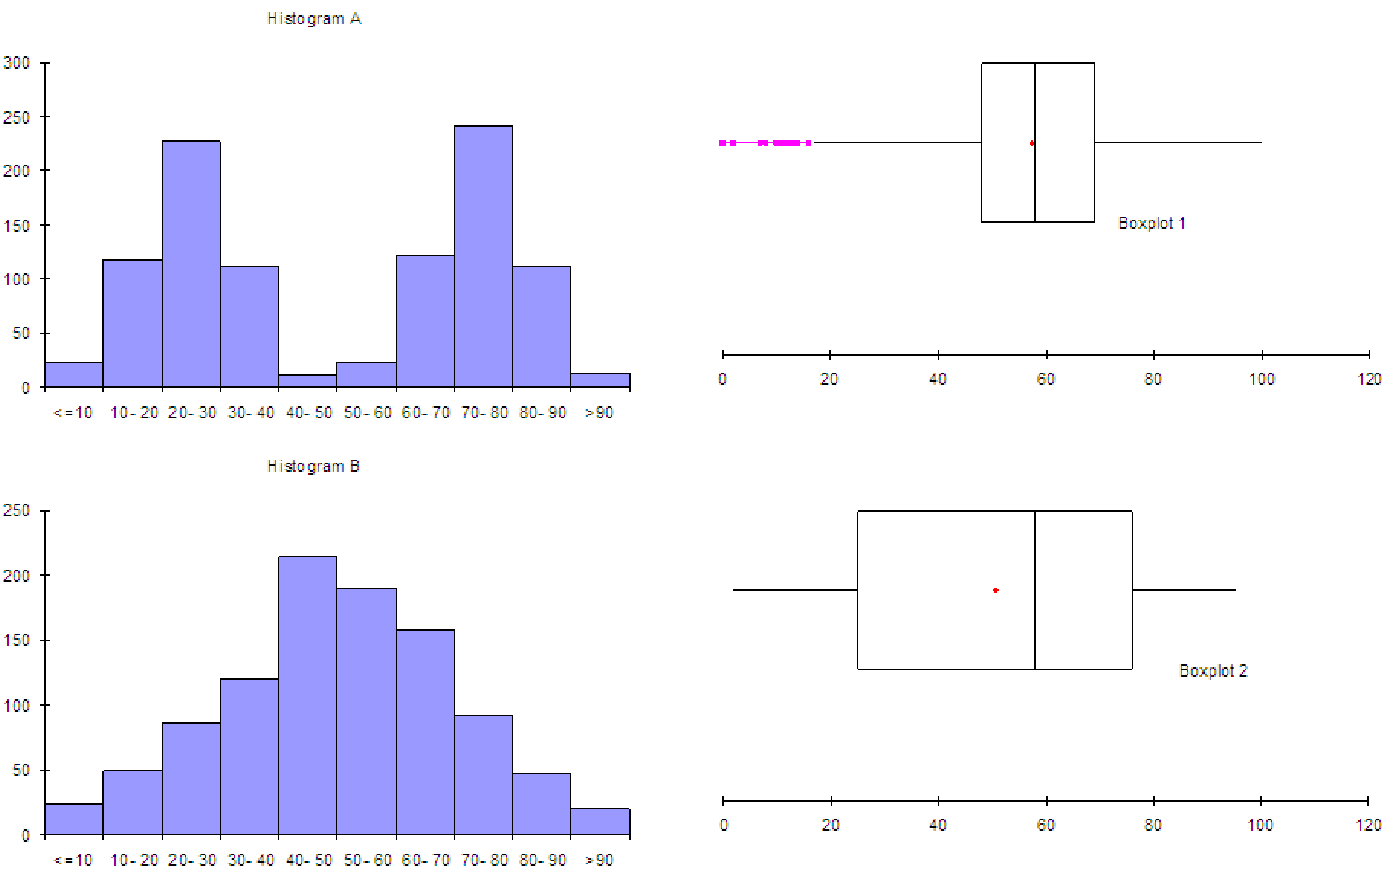
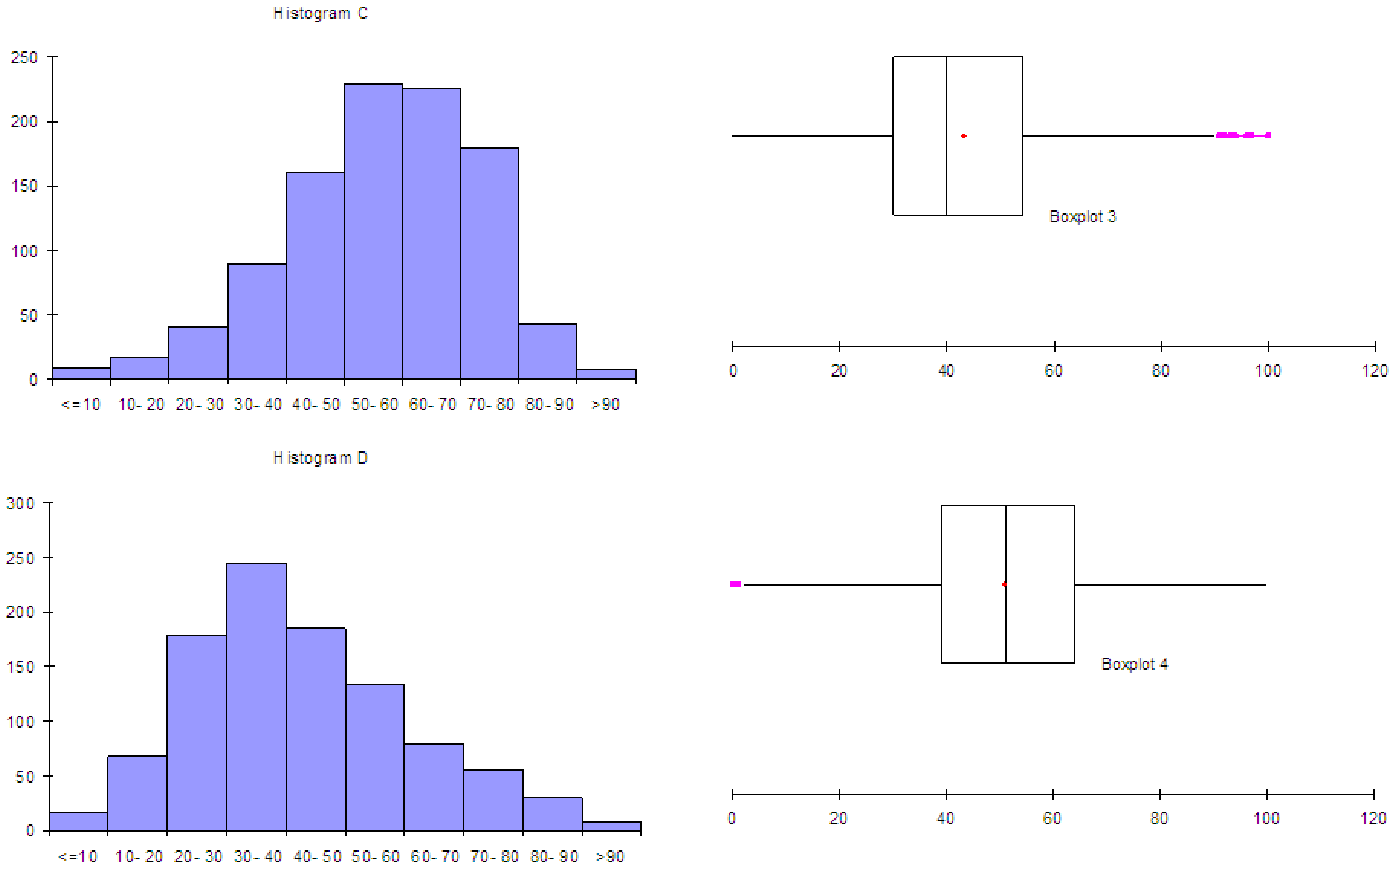
6.4. Match the histograms (labeled A - D) below with the boxplot (labeled 1 - 4) in figure 6.11 that best matches the data.