- By hand, calculate the average wait time for a
typical customer.
- How many customers waited less than the
average? How many waited more?
- By hand, compute the deviations from the mean
in a new column to the right of WaitTime.
- What was the largest deviation from the mean?
- What is the Total Deviation (or sum of the
deviations) for this set of data?
- Manually compute the Squared Deviation in a new
column to the right.
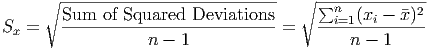
- Manually compute the Sum of the Squared
Deviations (SSD) for this set of data.
- Use your previous calculations to compute the
Standard Deviation as follows:
- Now use built-in spreadsheet functions to compute
the standard deviation.
- Use your software to compute the mean and standard
deviation for your competitor.
- For which of the two fast food restaurants is the
mean a better model for customer wait times?
Why?
| |
|
| | WaitTime | Competitor |
| (sec.) | (sec.) |
|
| | 90 | 210 |
|
| | 152 | 0 |
|
| | 113 | 118 |
|
| | 239 | 0 |
|
| | 54 | 185 |
|
| | 47 | 0 |
|
| | 72 | 16 |
|
| | 276 | 43 |
|
| | 114 | 17 |
|
| | 74 | 165 |
|
| | 61 | 23 |
|
| | 88 | 9 |
|
| | 84 | 134 |
|
| | 60 | 26 |
|
| | 55 | 22 |
|
| | 100 | 26 |
|
| | 53 | 36 |
|
| | 80 | 273 |
|
| | 92 | 83 |
|
| | 65 | 186 |
|
| | 56 | 109 |
|
| | 57 | 140 |
|
| | 72 | 48 |
|
| | 59 | 56 |
|
| | 103 | 132 |
|
| | 40 | 183 |
|
| | 52 | 153 |
|
| | 50 | 30 |
|
| | 21 | 72 |
|
| | 120 | 104 |
|
| | |
|