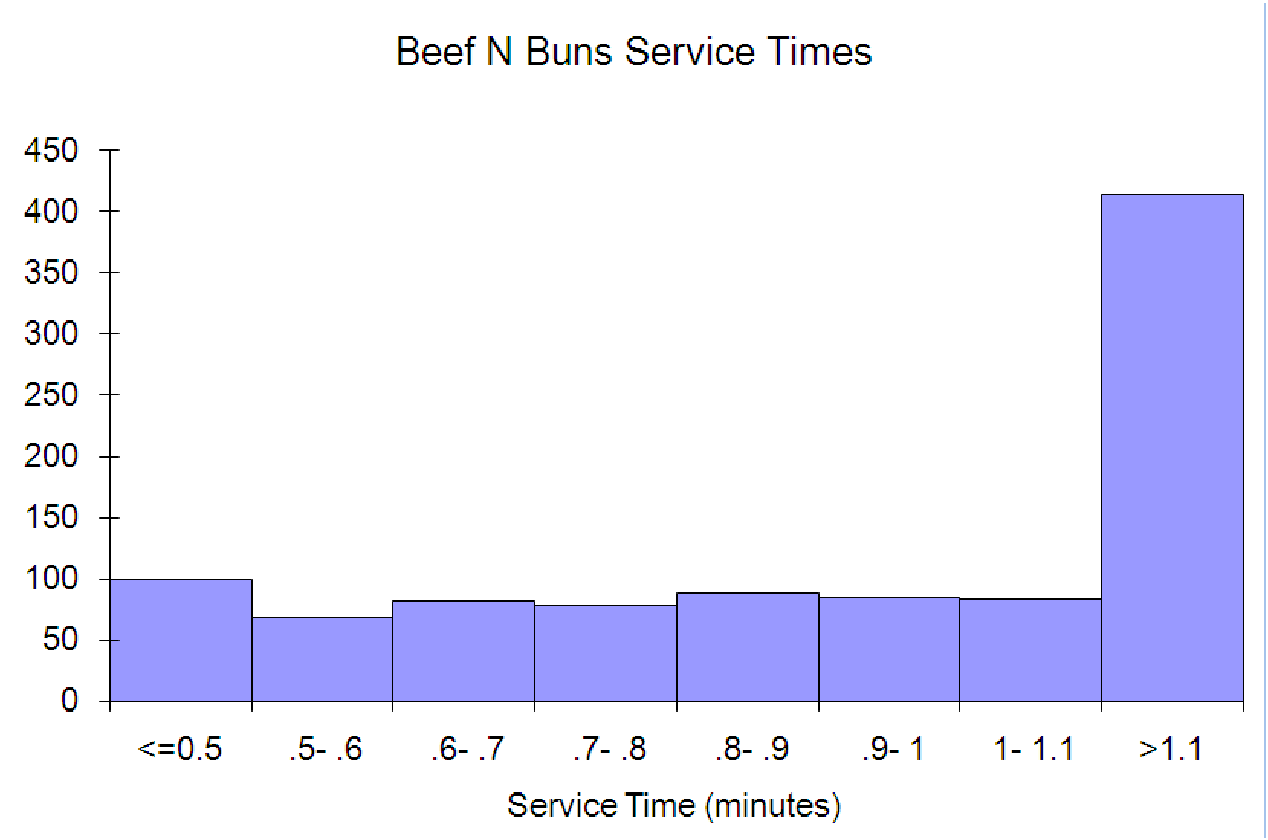
Figure 5.6: Sample histogram of service times at Beef n’ Buns.
The manager of a local fast-food restaurant is interested in improving the service provided to customers who use the restaurant’s drive-up window. As a first step in this process, the manager asks his assistant to record the time (in minutes) it takes to serve 200 different customers at the final window in the facility’s drive-up system. The given 200 customer service times are all observed during the busiest hour of the day for this fast-food operation. The data are in the file C05 BeefNBuns.xls [.rda]. Are shorter or longer service times more likely in this case?
STUDENT analysis: A student produces the graph shown and then states: ”As the graph below shows, most of the service times are on the higher end of the graph, so we expect that there will be many customer complaints.”