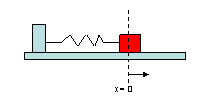
For this process, we are going to work through an applied example together. The basic idea is that we are going to study a physical system involving a mass on a spring. This mass slides back and forth on the table (friction!) and is attached to the wall by a spring.

Imagine that we want to record two pieces of information about the mass as it moves: its distance from the wall (position) and its velocity. Eventually, we'll write down a system of ODEs that represents this situation, but for now, imagine that x is the position of the mass and y is the velocity. (Note: The arrow in the picture denotes the direction in which x is positive.)
Question 6. Sketch a graph of what you think the phase portrait of this system would look like (the xy-plane). Use your extensive experience and knowledge of how masses on springs move. In your sketch, indicate any equilibrium points (if any) that you think exist.
Next, let's represent this analytically. The system of equations below represents this system, with b representing the amount of friction present. In this system, we have used units of measurement such that the mass is 1 and the spring constant (measuring the strength of the spring) is 2.

We'll use Maple to enter this system and explore its behavior for various values of the parameter b. The commands below will do two things: First, it will create a sequence with 21 different directions, each at a different value of b, determined by i=0..20 and (i/5). This means that we will get b=0, 1/5=0.2, 2/5=0.4, etc. up to b=20/5=4. The second command generates the visual representation of this as an animation. These commands will require that the DEtools and plots packages be loaded first, and they will take several seconds to run.
> PP := seq(DEplot([diff(x(t),t) = y(t), diff(y(t),t) =
-2*x(t) - (i/5)*y(t)], [x(t),y(t)], t=0..10, x=-5..5, y=-5..5), i=0..20);
> display(PP, insequence=true);
When complete, click on the direction field. When you do, you should get a set of "VCR" buttons at the top of the screen. Clicking on the third button over (the arrow with the vertical line) will advance one frame of the animation (one value of b) at a time, allowing you to see what happens to the vector field as you change the value of b.

Question 7. Use the animation of the system to explore how the friction parameter affects the system. Use graphs and descriptions of those graphs to summarize the results of your investigation. Be as specific as possible. In addition, discuss changes, if any, to the type of equilibrium solution as the friction parameter changes. BONUS: How does the graphic representation of the system relate to the physical system itself with the mass and the spring?
Question 8. Marissa sets the friction parameter to 3 and notices that graphs of solutions in the position velocity plane seem to get sucked into the origin via a straight line. She conjectures that along this line, all vectors head directly toward the origin with a specific slope. Do you agree with Marissa's conjecture? Figure out an algebraic way to either support or refute this conjecture. If you think the conjecture is true, (a) What is the precise slope? (b) What is the corresponding physical motion of the mass? (c) What are the corresponding x(t) and y(t) equations?
Question 9. Suppose you were to start with an initial condition somewhere in the second quadrant between the two straight line solutions, say at (-4, 6). Sketch what you think the solution, as in the phase plane, looks like.
Question 10. Figure out what the x(t) and y(t) equations are for the solution with initial condition (-4, 6). According to these equations, what should the solution in the phase plane look like?
| Back to previous screen |
Written and posted by Dr. Kris H. Green, March 24, 2004