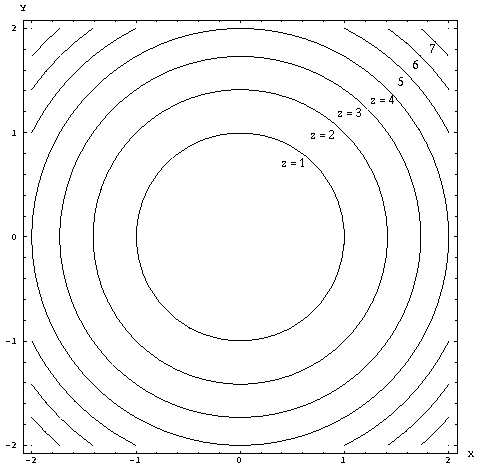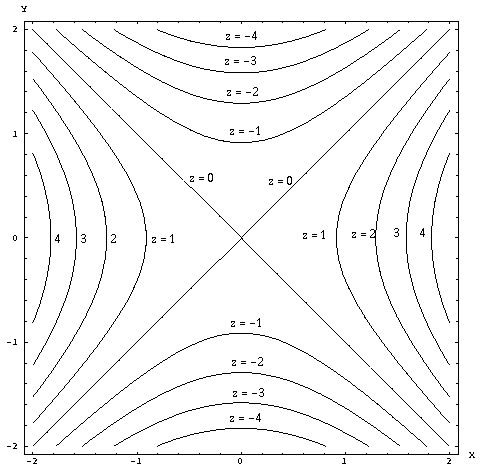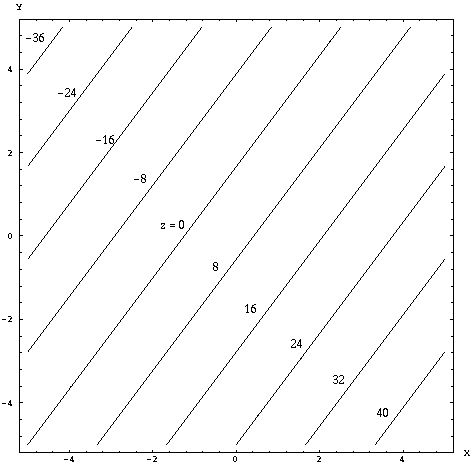
The next simplest method for picturing functions of two variables is called contour plotting. With sections, we're looking at the surface from the side, either along the x axis in the case of sections with x fixed or along the y axis if y is fixed. A contour plot views the function from above, looking down from the z axis. Algebraically, creating a contour plot is very similar to creating a section. However, instead of fixing x or y equal to a constant, in the case of contours, we fix z = c where c is a constant. We then graph y as a function of x and label the contour with the value of z. Thus, the contour is a line in the xy-plane that connects all points with the same value of z.
In other words, if we want to draw the contour with z = c of the function z = f(x,y) we simply set f(x,y) = c and graph this in the xy-plane. If we graph several contours at equally spaced values of z = c we get a top-down view of the function.
For example, contours of the function z = x2 + y2 are easily seen to be
circles. Set z = c. It is then clear that x2 + y2 = c. Thus, the
contours of this function are clearly circles, centered at the origin of
the xy-plane, having a radius of ![]() .
.

Let's try the saddle-shaped function from the previous section. In the
function z = x2 - y2 setting z = c produces contours with the shape
of hyperbolas.

Here's an easy one. In the function z = 4x - 3y + 5 what shape are the
contours? If we set z = c we see that ![]() . Thus, the contours are all straight lines with slope
4/3 in the xy-plane.
. Thus, the contours are all straight lines with slope
4/3 in the xy-plane.

Picturing the surface from the contour plot is about as easy as picturing it from the sectionings. Imagine the z axis coming out of the screen. Each contour is labeled with a value of z. Move the entire contour line to that distance along the z axis, away from the xy-plane of the screen. Then try to see how that surface fits onto this. Remember that points in between two contours take values that lie between the values of the two contours.
Click here to view an animation of this process in another window. When you are finished viewing, simply close that window to return the text here.