How do you turn a parameterization into a curve so that you can start
drawing neat pictures too? A parameterization is simply ![]() in two dimensions, so if we can
solve x = x(t) for t = g(x) we can plug this into y = y(t) = y(g(x))
to get y in terms of x and then graph the result from the point (x(a),
y(a)) to (x(b), y(b)).
in two dimensions, so if we can
solve x = x(t) for t = g(x) we can plug this into y = y(t) = y(g(x))
to get y in terms of x and then graph the result from the point (x(a),
y(a)) to (x(b), y(b)).
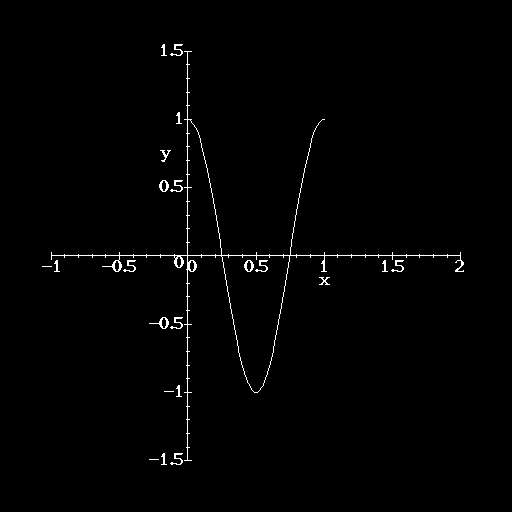
Example. If ![]() then
then ![]() so
so ![]() . Thus, this curve is simply a shifted cosine
curve, with period 1 that passes from (x(0), y(0)) = (1,1) to (x(1),
y(1)) = (0,1).
. Thus, this curve is simply a shifted cosine
curve, with period 1 that passes from (x(0), y(0)) = (1,1) to (x(1),
y(1)) = (0,1).

Another method is to simply plot the points that the curve passes through and then connect them based on common sense.
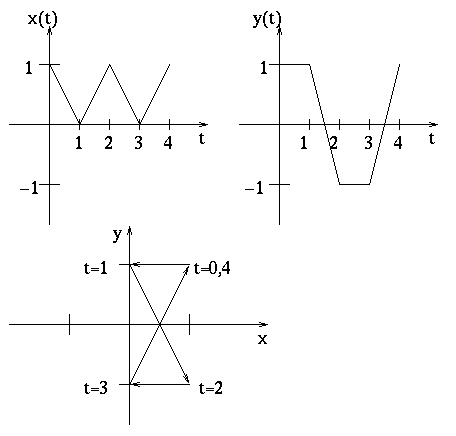
Example. Suppose the following graphs give x =x(t) and y = y(t). From this, we can create the following table of points along the curve:
| t | x | y |
| 0 | 1 | 1 |
| 1 | 0 | 1 |
| 2 | 1 | -1 |
| 3 | 0 | -1 |
| 4 | 1 | 1 |
From this table we can construct the graph of the curve, using the fact that x and y vary smoothly from point to point, but discontinuously at integer values of t.

At other times, you may simply know what the curve should look like from a little experience and advanced knowledge.
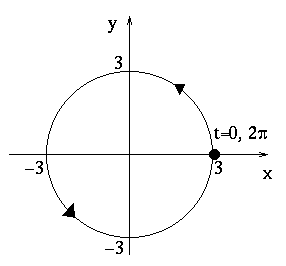
Example. Graph the curve parameterized by ![]() . Notice that
. Notice that ![]() for all values of t. Thus, all points on this curve are
the same distance, namely three units, from the origin. Also note that
for all values of t. Thus, all points on this curve are
the same distance, namely three units, from the origin. Also note that
![]() which is never
which is never ![]() so the particle never stops moving. In fact,
so the particle never stops moving. In fact, ![]() .Thus, the particle moves at constant speed. The
acceleration vector is
.Thus, the particle moves at constant speed. The
acceleration vector is ![]() so the
acceleration is exactly opposite to the position vector. Add to this the
fact that
so the
acceleration is exactly opposite to the position vector. Add to this the
fact that ![]() and that
and that ![]() and we have that the path is a circle, centered at
the origin with radius 3. Since (x(0), y(0)) = (3,0) and y is initially
increasing, the particle is moving counterclockwise.
and we have that the path is a circle, centered at
the origin with radius 3. Since (x(0), y(0)) = (3,0) and y is initially
increasing, the particle is moving counterclockwise.
