 |  |
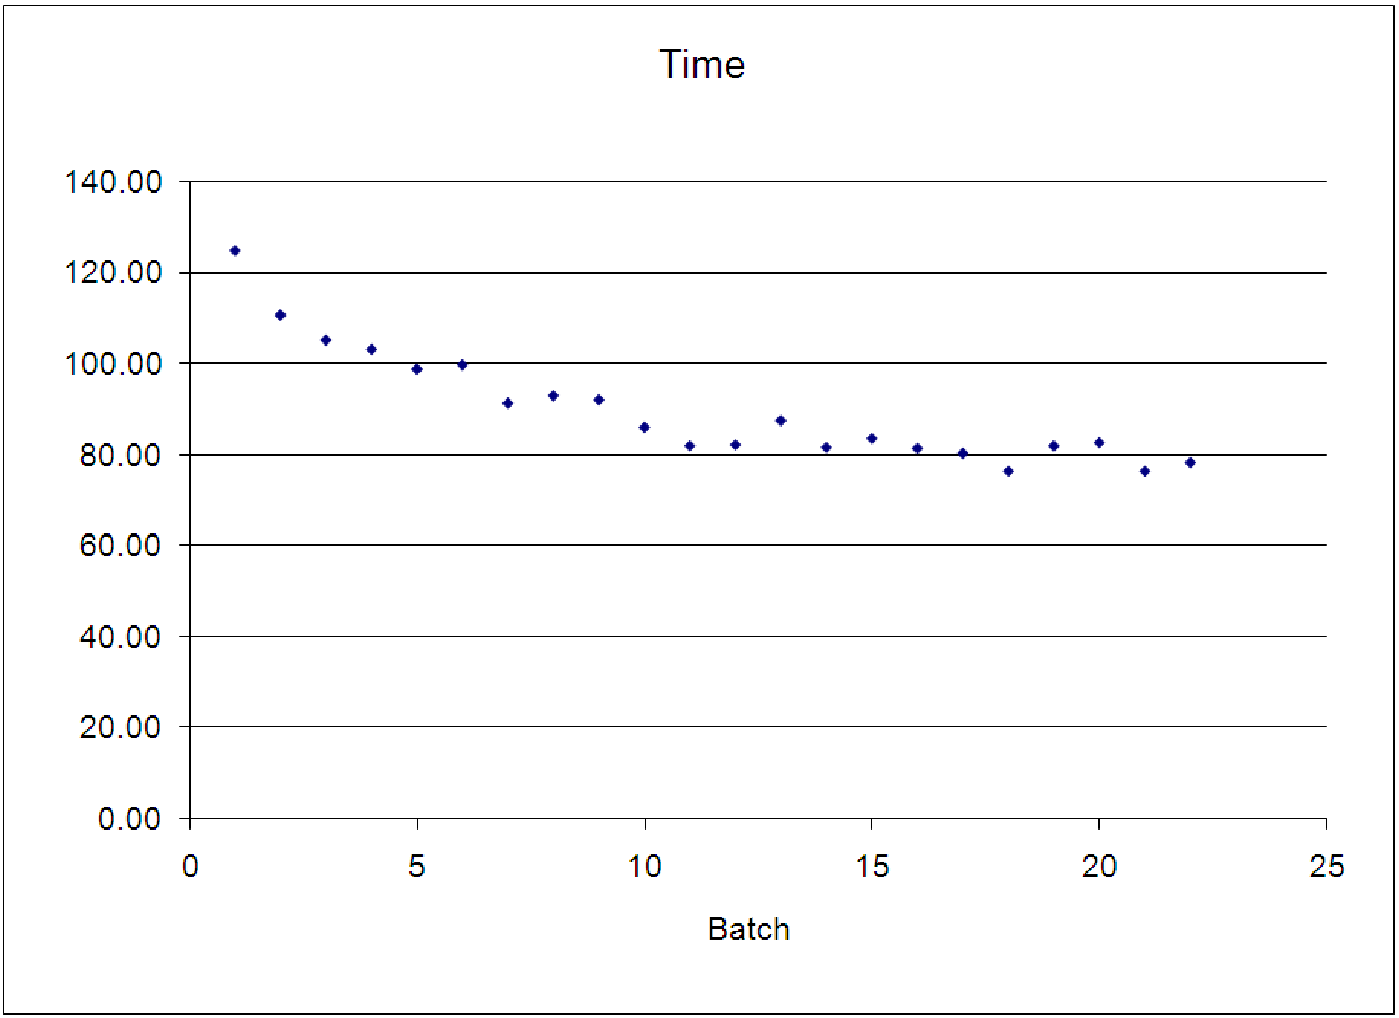 | 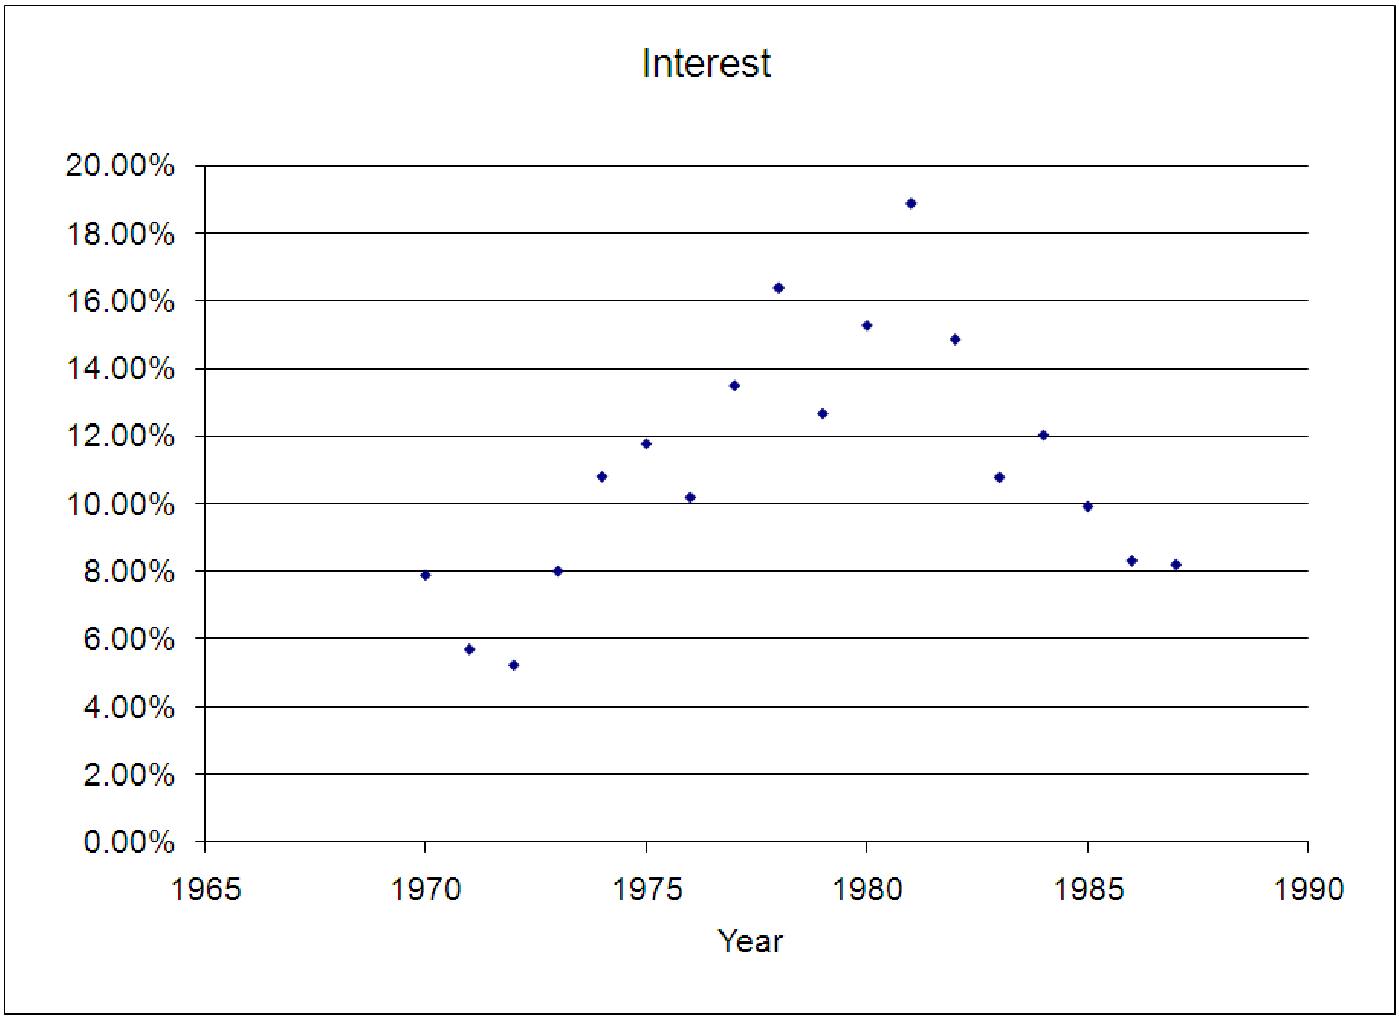 |
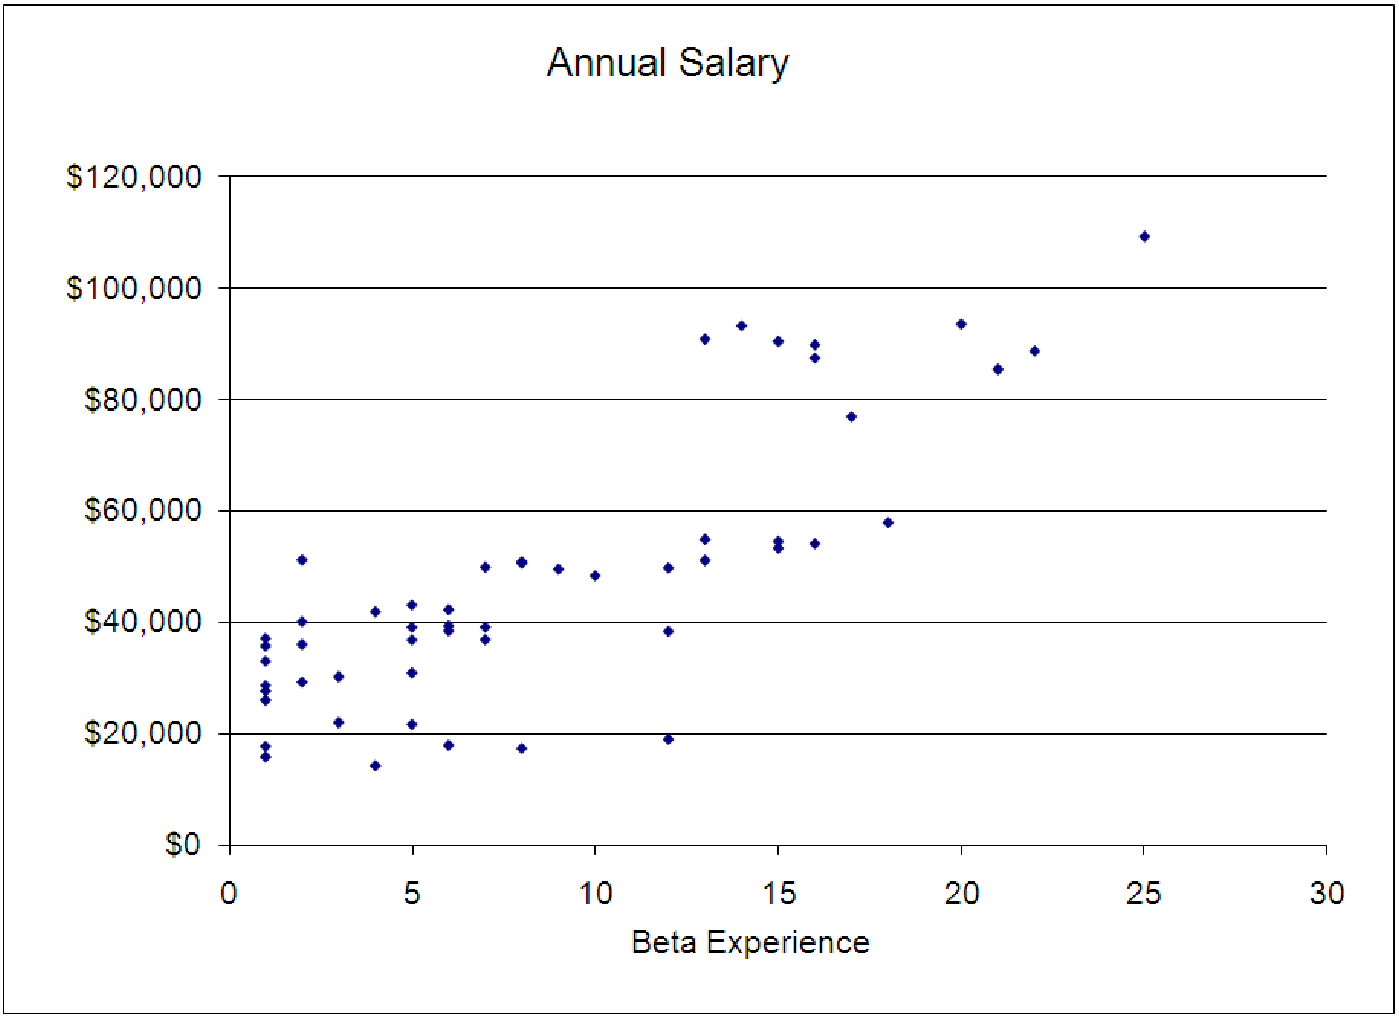
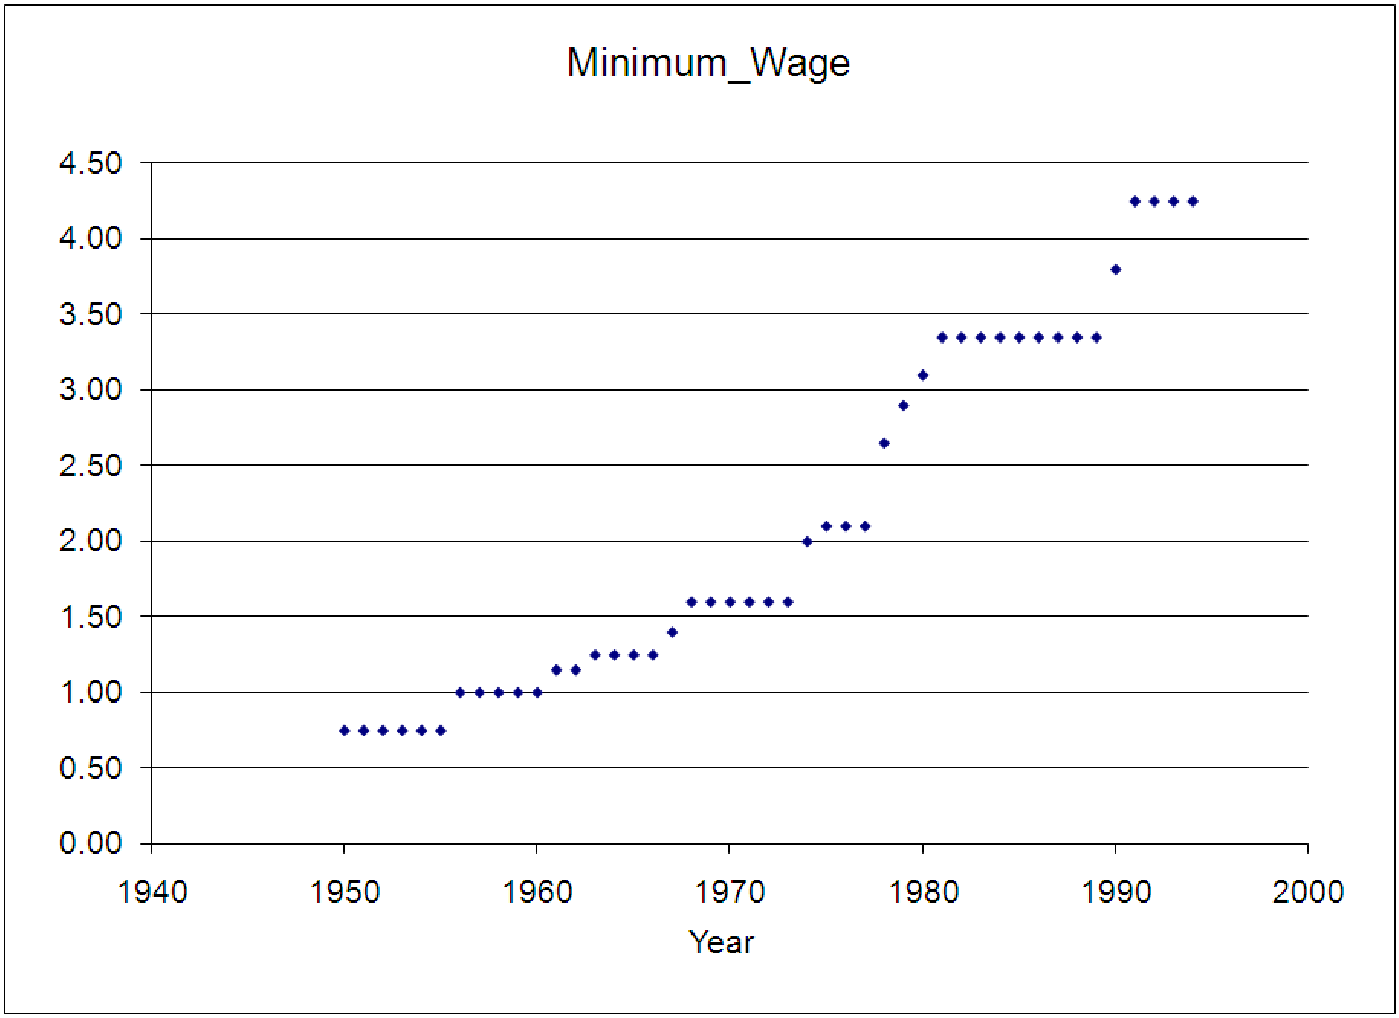
Four graphs are shown below. For each, consider which of the basic functions you think would fit the data best. For your function, then describe what you think should be done to its graph in order to make it fit the data best. It might need to be shifted left or right, sifted up or down, flipped vertically or horizontally, stretched or squashed, or some combination of these.
| | |
| | |
| Data | Best choice for basic function | How to alter the function to fit |
| Annual Salary |
|
|
|
|
| |
| Minimum Wage |
| |
|
|
|
|
| Time |
|
|
|
|
|
|
| Interest |
|
|
|
|
|
|
Now open the file C11 Exploration2.xls [.rda]. Test each of the possible trendlines (linear, logarithmic, exponential, power and polynomial of order 2 - do not use the moving average or higher order polynomials.) Be sure you display the equation and R2 value for each of the possible models. Write down the equation of the best fitting model and record its R2 in the chart below.
| Data | Best Fit Trendline Equation | R2 |
| Annual Salary |
|
|
|
|
| |
| Minimum Wage |
| |
|
|
|
|
| Time |
|
|
|
|
|
|
| Interest |
|
|
|
|
|
|