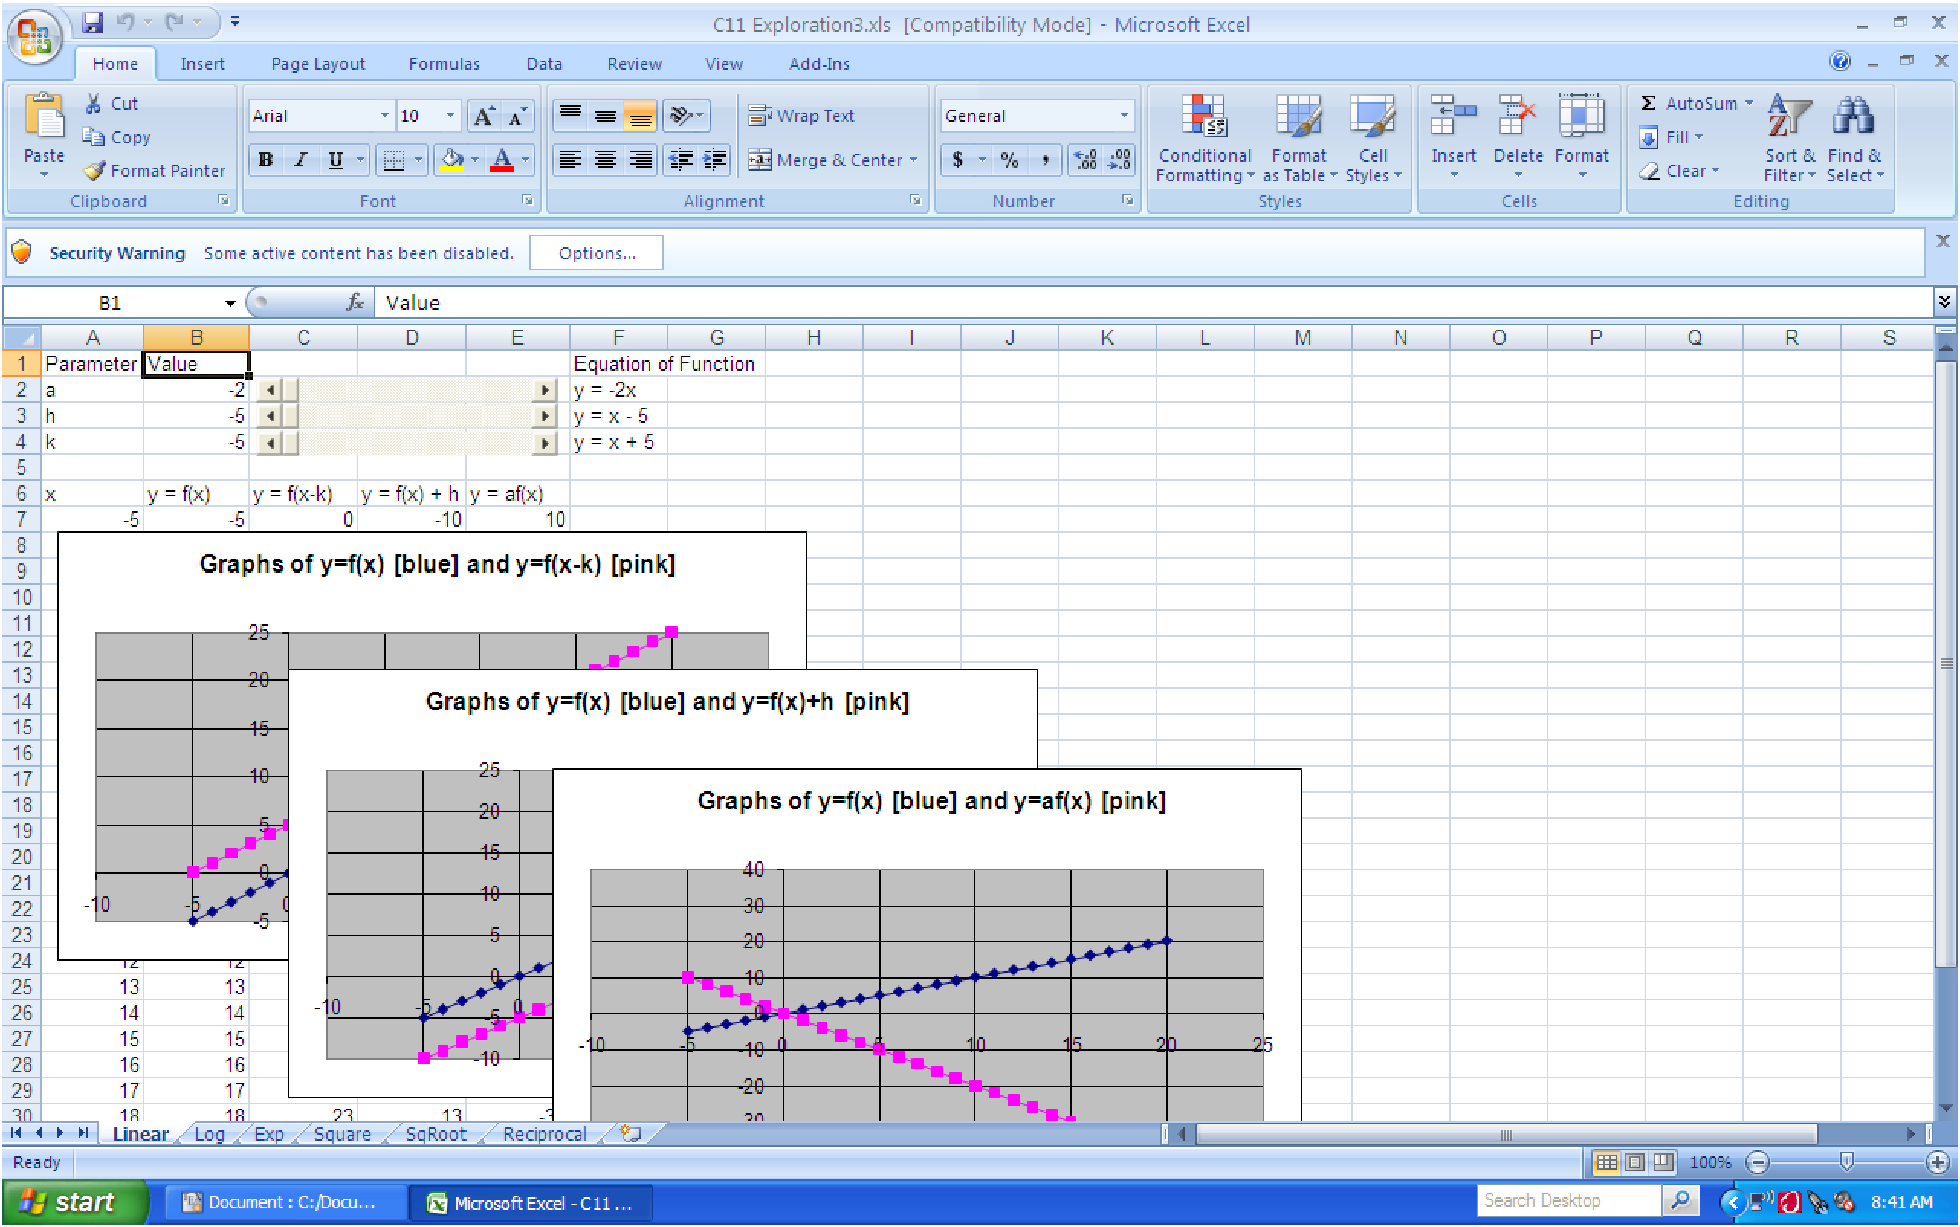
Figure 11.17: Excel file for exploring the various shifts and scalings with the basic functions.
Download and open the file C11 Exploration3.xls [.rda]. The file contains several macros, so when you open the file, you you may need to click on the options button next to the security warning. Then select the option labeled ”enable the content”. (This is part of the security of the computer; many viruses and computer worms are hidden in macros.) When you get the file open, you should see a screen like the one shown below:
There are six worksheets in the workbook, one for each of the basic functions we have been discussing. On each worksheet there are three slider bars and three graphs. Each graph shows the graph of the basic function itself (in blue) and one other graph (in pink). As you change the slider values, make note of how the graph of the pink function changes and how the different equations shown next to the slider bars change. To see some of the graphs, you may need to right click on them and select ”Bring to Front” since Excel layers its graphs on top of each other in order to save ”screen real estate”. Use the worksheets and the sliders to help fill in the details about each of the functions below.
| Linear Function, f(x) = x
| ||
| Modification | Sketch | Description |
| y = af(x) |
|
|
|
|
| |
|
| ||
| y = f(x - h) |
|
|
|
|
|
|
|
|
|
|
| y = f(x) + k |
|
|
|
|
|
|
|
|
|
|
| Logarithmic Function, f(x) = ln(x)
| ||
| Modification | Sketch | Description |
| y = af(x) |
|
|
|
|
| |
|
| ||
| y = f(x - h) |
|
|
|
|
|
|
|
|
|
|
| y = f(x) + k |
|
|
|
|
|
|
|
|
|
|
| Exponential Function, f(x) = ex
| ||
| Modification | Sketch | Description |
| y = af(x) |
|
|
|
|
| |
|
| ||
| y = f(x - h) |
|
|
|
|
|
|
|
|
|
|
| y = f(x) + k |
|
|
|
|
|
|
|
|
|
|
| Squaring Function, f(x) = x2
| ||
| Modification | Sketch | Description |
| y = af(x) |
|
|
|
|
| |
|
| ||
| y = f(x - h) |
|
|
|
|
|
|
|
|
|
|
| y = f(x) + k |
|
|
|
|
|
|
|
|
|
|
| Square Root Function, f(x) =
 | ||
| Modification | Sketch | Description |
| y = af(x) |
|
|
|
|
| |
|
| ||
| y = f(x - h) |
|
|
|
|
|
|
|
|
|
|
| y = f(x) + k |
|
|
|
|
|
|
|
|
|
|
| Reciprocal Function, f(x) =
 | ||
| Modification | Sketch | Description |
| y = af(x) |
|
|
|
|
| |
|
| ||
| y = f(x - h) |
|
|
|
|
|
|
|
|
|
|
| y = f(x) + k |
|
|
|
|
|
|
|
|
|
|