14.2.1 Definitions and Formulas
-
Critical point
- Any point on the graph of function f where the derivative is zero is a critical
point. Thus, we can find all the critical points by solving the equation f′(x) = 0. Often,
this will be a nonlinear equation and will require some algebra to solve.
-
Extrema
- An extrema is some ”extreme” point on a function: either a maximum or a
minimum.
-
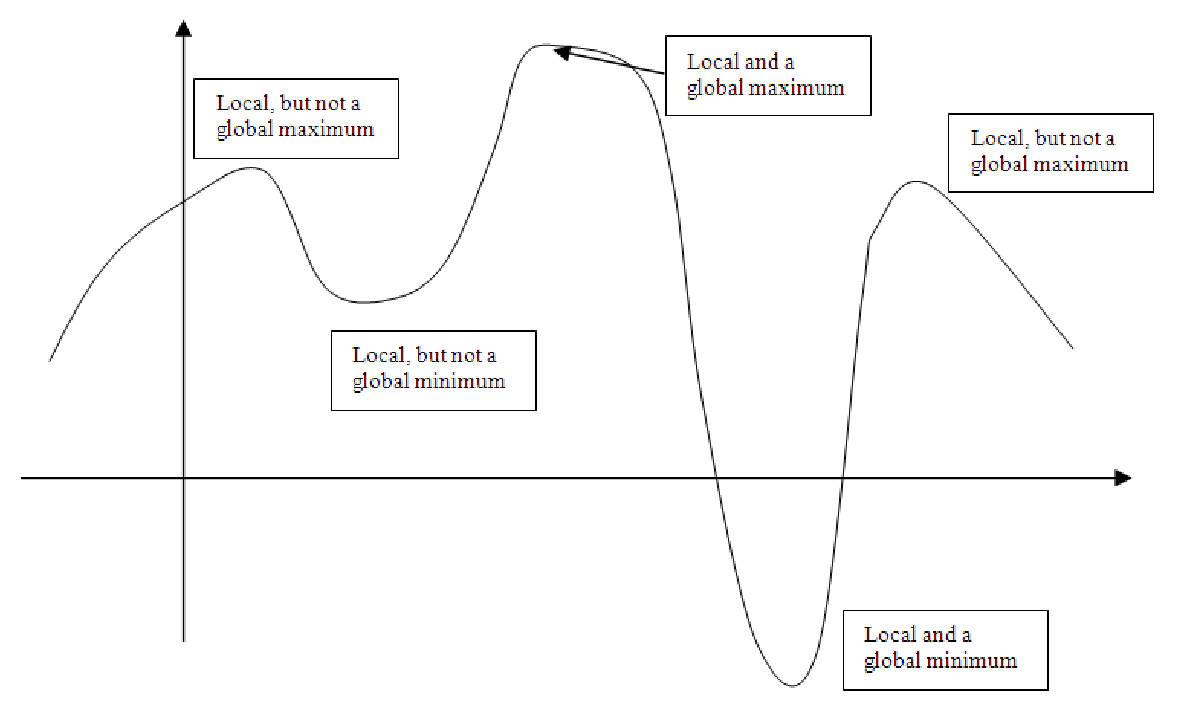
Local Maximum
- A local maximum is a point on the graph of a function that is higher
than all the points that are close by it. Thus, the point looks like the top of a hill.
Point D in the graph at the end of the definitions fromthe last section is an example
of a local maximum. See the graph below.
-
Local Minimum
- A local minimum is a point on the graph of a function that is lower than
all the points that are close by it. Thus, the point looks like the bottom of a valley.
Point B in the graph at the end of the definitions from the last section is an example
of a local minimum. See the graph below.
-
Global Maximum
- A global maximum is the highest point on a function anywhere not just
when compared to points near it. Most functions have lots of hills and valleys; only the
highest peak in the ”mountain range of the function” would be the global maximum.
See the graph below.
-
Global Minimum
- A global minimum is the lowest point on a function anywhere not just
when compared to points near it. Most functions have lots of hills and valleys; only the
lowest valley in the ”mountain range of the function” would be the global maximum.
See the graph below.
-
Optimization
- This is the process of finding and classifying all the extrema for a function
and then using this to solve some problem. For example, we may have a function that
describes our profits from manufacturing a quantity q of a good. Optimization would
help us answer the question ”How many of this good should we make in order to get
the highest profit?”
-
Second Derivative Test
- Solving the equation f′(x) = 0 only finds extreme points. You
then need to classify the points as maxima or minima (the plurals of maximum and
minimum, respectively). One way to do this is by graphing the function. The other way
is by evaluating the second derivative of the function at the critical point. If the second
derivative is negative, you have a maximum (the graph is concave down, as at Point D
in figure 14.5, pge 821.) If the second derivative is positive, you have a minimum (the
graph is concave down, as at Point B in 14.5.) If the second derivative is zero, then
you don’t have a maximum or a minimum, necessarily.