There are three different ways to represent a system graphically: by plotting the individual solutions for each ODE in the system (against the independent variable) [these are called component plots], plotting the dependent variables against each other [called phase plots], and by plotting the direction field of the system.
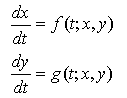
Component plots are what we are used to plotting for ODEs. If the system looks like
then there are two component plots representing the solutions, one for x(t) versus t and one for y(t) versus t.
In a phase plot, we do not concern ourselves with the specific changes in the dependent variables over time; instead we look at how the dependent variables relate to each other. We plot y(t) versus x(t). Such plots can show us whether increases in one dependent variable are related to increases in the other variable or whether increases in one variable are related to decreases in the other variable.
Show plot for a particular system.
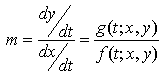
Direction fields for systems are very similar to direction fields for single ODEs. We simply go through the xy-plane and plot small direction arrows with slopes given by the value of
Show the direction field for the same system.
The following commands will help you define a system of ODEs and then plot them in MAPLE.
This is pretty straightforward: First define each ODE and then combine them with brackets.
> ODE1 := diff(x(t),t) = x(t) - 3*x(t)*y(t);
> ODE2 := diff(y(t),t) = -0.5*y(t) + 1.2*x(t)*y(t);
> SYS := [ODE1, ODE2];
Now we load the DEtools and plots packages using the "with" commands.
> with(plots): with(DEtools):
Next, we use the DEplot command to graph the system. The following command will graph the direction field on a set of xy-axes that go from -3 to 3 in both the x and y direction.
> DEplot(SYS, [x(t), y(t)], t=-5..5, x=-3..3, y=-3..3, arrows=medium);
By adding options to this command, we can plot solutions to the system on the direction field (phase plots). The form of the command below will add two solutions, one with initial conditions x(0)=1, y(0)=1 and one with x(0)=-1, y(0)=-1 in blue.
> DEplot(SYS, [x(t), y(t)], t=-5..5, x=-3..3, y=-3..3, [[x(0)=1, y(0)=1],[x(0)=-1, y(0)=-1]], linecolor=BLUE, arrows=medium);
Notice that the initial conditions are in the form "[ [x(0)=a1, y(0)=b1], [x(0)=a2, y(0)=b2], [x(0)=a3, y(0)=b3], ...]" You can add as many conditions as you want, so long as each condition (a pair of values for x and y) is in brackets [] and the entire list is in brackets []. You may also find that the solution curves are "blocky" because of poor resolution in the numerical solver (large stepsize). We can control the stepsize with an option, making the curves smoother and more accurate:
> DEplot(SYS, [x(t), y(t)], t=-5..5, x=-3..3, y=-3..3, [[x(0)=1, y(0)=1],[x(0)=-1, y(0)=-1]], linecolor=BLUE, arrows=medium, stepsize=0.1);
Finally, we can generate component plots by specifying a "scene" - a set of axes from which to view the system.
> DEplot(SYS, [x(t), y(t)], t=-5..5, x=-3..3, y=-3..3, [[x(0)=1, y(0)=1],[x(0)=-1, y(0)=-1]], scene=[t,y], linecolor=BLUE, arrows=medium);
The command above will plot the graph of the solutions as y(t) vs. t. The "scene" option is expressed in the form
scene=[horizontal axis variable, vertical axis variable]
QUESTION 2. Use MAPLE to graph the three types of graphical representations of the system above. Describe how the solutions behave in words. Your description should address long term behavior and obvious features of each graph, as well as the interaction between the two dependent variables. Try plotting solutions with many different initial conditions.
| Back to previous screen |
Written and posted by Dr. Kris H. Green, March 24, 2004