13.1.3 Exploration 13A: Revenue and Demand Functions

File C13 Exploration A.xls [.rda] contains weekly sales and revenue information for two different companies. The first worksheet, labeled ”Company 1” shows the quantities of two complementary commodities that are sold by this company. These items are X and Y. The second sheet contains data on two substitute commodities sold by ”Company 2”.

  1. Formulate a quadratic regression model for Company 1’s revenue as a function of the quantity of each item that is produced and sold.
  2. Formulate a quadratic regression model for Company 2’s revenue as a function of the quantity of each item that is produced and sold.

    You should now have two revenue functions that look something like this:

                  2     2
R(q1,q2) = Aq1 + Bq 2 + Cq1q2 + Dq1 +  Eq2 + F

    Where the capital letters are constants and variables q1 and q2 represent the quantity of goods of each type.

  3. Explain why, in the revenue formula above, you would expect F, the constant term, to be zero. Do your regression models match this prediction?

    We are going to use these revenue functions to determine the demand functions for the products in each case. Recall that the demand function gives the unit price that the market will pay for something, given the supply (in this case the quantities q1 and q2) of the item(s) being sold. To find the demand functions, we need to write the revenue function in the form

    R (q1,q2) = q1p1 + q2p2

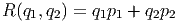
    In this formula, the p1 and p2 are the unit prices. We will assume that these are both linear functions of the two quantities.

  4. What does it mean in the last sentence when it says that p1 and p2 are a linear function of the quantities? Give a sample function that could represent p1 or p2.
  5. Try to find the demand functions for each situation. You can do this by (a) factoring the regression models you have formulated above and (b) assuming that the term with the coefficient C in the revenue formula is split equally between the two demand functions.
  6. Use your demand functions to fill in the tables below, showing the estimated prices customers would pay at each company for different supplies of the two goods.


    Company 1

    Company 2


    q1 q2

    p1

    p2

    q1 q2

    p1

    p2


    1000 1000

    2000 2500


    1100 1000

    2100 2500


    1000 1100

    2000 2600


  7. Based on your demand functions (you should now have four: two for each scenario) and your data in the tables above what do you think are meant by the terms ”complementary commodities” and ”substitute commodities”?